

This estimation leads to a minimum grain size for dislocation deformation in the
range from 10 to 100 nm. This result fits well with experimental findings, where
grain sizes in the range between 10 and 50 nm serve as limits for deformation
processes via dislocations. Therefore, as in most nanocrystalline materials, Frank–
Reed sources for dislocation generation are, in many cases, impossible; hence,
deformation of these materials via dislocations is not possible.
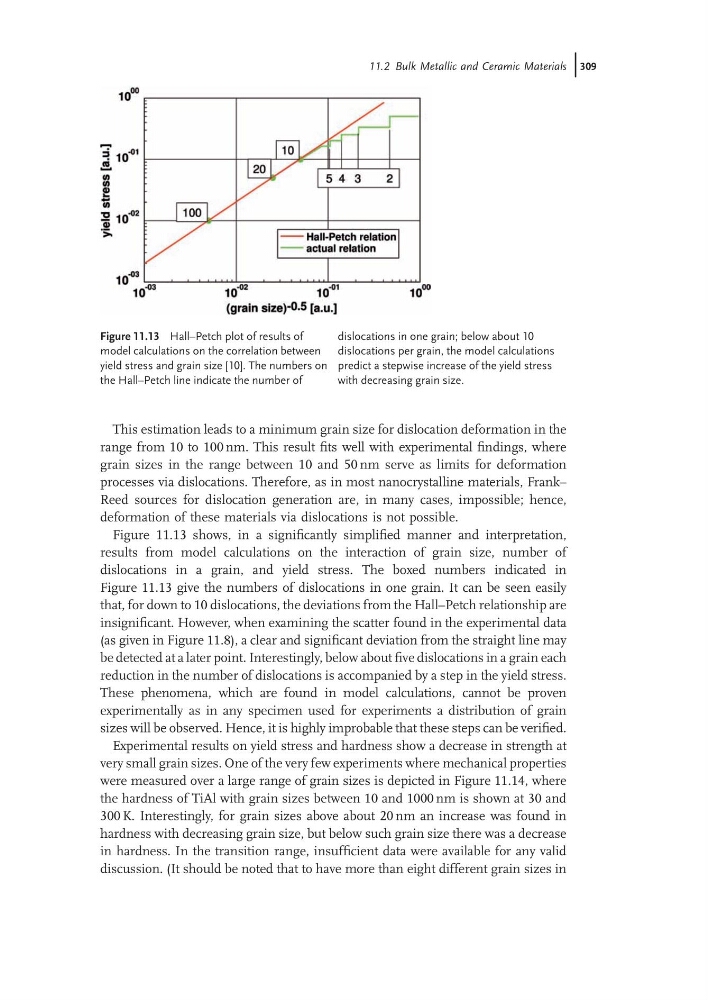
Figure 11.13 shows, in a significantly simplified manner and interpretation,
results from model calculations on the interaction of grain size, number of
dislocations in a grain, and yield stress. The boxed numbers indicated in
Figure 11.13 give the numbers of dislocations in one grain. It can be seen easily
that, for down to 10 dislocations, the deviations from the Hall–Petch relationship are
insignificant. However, when examining the scatter found in the experimental data
(as given in Figure 11.8), a clear and significant deviation from the straight line may
be detected at a later point. Interestingly, below about five dislocations in a grain each
reduction in the number of dislocations is accompanied by a step in the yield stress.
These phenomena, which are found in model calculations, cannot be proven
experimentally as in any specimen used for experiments a distribution of grain
sizes will be observed. Hence, it is highly improbable that these steps can be verified.
Experimental results on yield stress and hardness show a decrease in strength at
very small grain sizes. One of the very few experiments where mechanical properties
were measured over a large range of grain sizes is depicted in Figure 11.14, where
the hardness of TiAl with grain sizes between 10 and 1000 nm is shown at 30 and
300 K. Interestingly, for grain sizes above about 20 nm an increase was found in
hardness with decreasing grain size, but below such grain size there was a decrease
in hardness. In the transition range, insufficient data were available for any valid
discussion. (It should be noted that to have more than eight different grain sizes in
Figure 11.13 Hall–Petch plot of results of
model calculations on the correlation between
yield stress and grain size [10]. The numbers on
the Hall–Petch line indicate the number of
dislocations in one grain; below about 10
dislocations per grain, the model calculations
predict a stepwise increase of the yield stress
with decreasing grain size.
11.2 Bulk Metallic and Ceramic Materials j309
range from 10 to 100 nm. This result fits well with experimental findings, where
grain sizes in the range between 10 and 50 nm serve as limits for deformation
processes via dislocations. Therefore, as in most nanocrystalline materials, Frank–
Reed sources for dislocation generation are, in many cases, impossible; hence,
deformation of these materials via dislocations is not possible.
Figure 11.13 shows, in a significantly simplified manner and interpretation,
results from model calculations on the interaction of grain size, number of
dislocations in a grain, and yield stress. The boxed numbers indicated in
Figure 11.13 give the numbers of dislocations in one grain. It can be seen easily
that, for down to 10 dislocations, the deviations from the Hall–Petch relationship are
insignificant. However, when examining the scatter found in the experimental data
(as given in Figure 11.8), a clear and significant deviation from the straight line may
be detected at a later point. Interestingly, below about five dislocations in a grain each
reduction in the number of dislocations is accompanied by a step in the yield stress.
These phenomena, which are found in model calculations, cannot be proven
experimentally as in any specimen used for experiments a distribution of grain
sizes will be observed. Hence, it is highly improbable that these steps can be verified.
Experimental results on yield stress and hardness show a decrease in strength at
very small grain sizes. One of the very few experiments where mechanical properties
were measured over a large range of grain sizes is depicted in Figure 11.14, where
the hardness of TiAl with grain sizes between 10 and 1000 nm is shown at 30 and
300 K. Interestingly, for grain sizes above about 20 nm an increase was found in
hardness with decreasing grain size, but below such grain size there was a decrease
in hardness. In the transition range, insufficient data were available for any valid
discussion. (It should be noted that to have more than eight different grain sizes in
Figure 11.13 Hall–Petch plot of results of
model calculations on the correlation between
yield stress and grain size [10]. The numbers on
the Hall–Petch line indicate the number of
dislocations in one grain; below about 10
dislocations per grain, the model calculations
predict a stepwise increase of the yield stress
with decreasing grain size.
11.2 Bulk Metallic and Ceramic Materials j309