

viscosity” in Figure 10.30, the epoxy resin was dissolved in acetone to reduce the
viscosity, while in the second method a commercial epoxy resin was used. In both
cases, the carbon fibers were dispersed in the liquid by stirring and sonication at
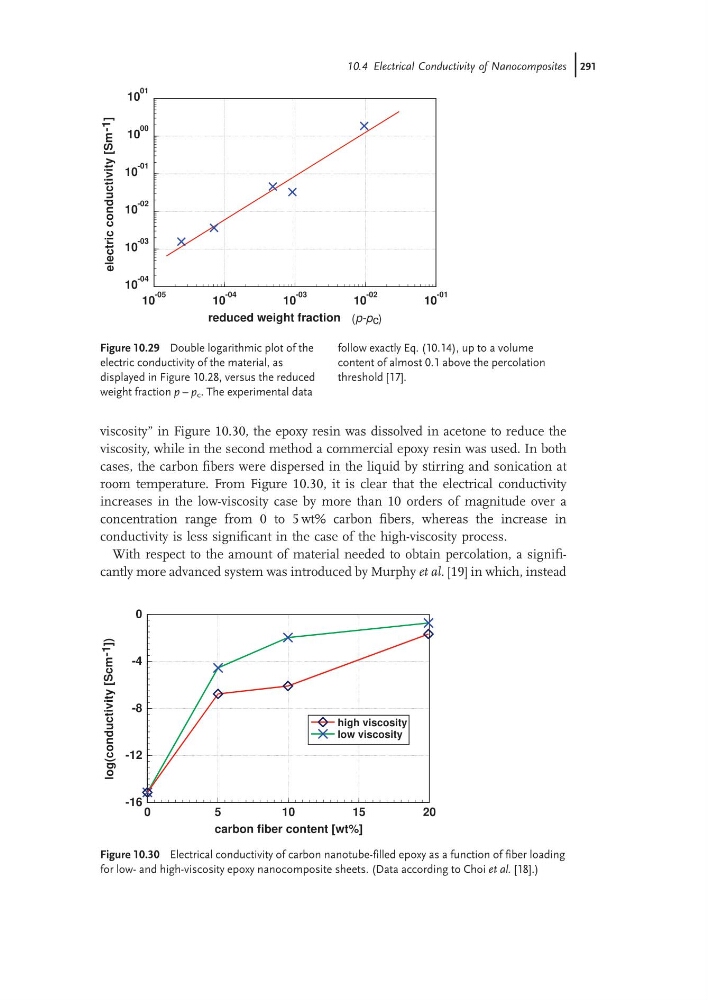
room temperature. From Figure 10.30, it is clear that the electrical conductivity
increases in the low-viscosity case by more than 10 orders of magnitude over a
concentration range from 0 to 5 wt% carbon fibers, whereas the increase in
conductivity is less significant in the case of the high-viscosity process.
With respect to the amount of material needed to obtain percolation, a significantly more advanced system was introduced by Murphy et al. [19] in which, instead
10
-05
10
-04
10
-03
10
-02
10
-01
reduced weight fraction (p-p c )
10
-04
10
-03
10
-02
10
-01
10
00
10
01
electric
conductivity
[Sm
-1 ]
Figure 10.29 Double logarithmic plot of the
electric conductivity of the material, as
displayed in Figure 10.28, versus the reduced
weight fraction p – p c . The experimental data
follow exactly Eq. (10.14), up to a volume
content of almost 0.1 above the percolation
threshold [17].
0
5
10
15
20
carbon fiber content [wt%]
-16
-12
-8
-4
0
log(conductivity
[Scm
-1 ])
high viscosity
low viscosity
Figure 10.30 Electrical conductivity of carbon nanotube-filled epoxy as a function of fiber loading
for low- and high-viscosity epoxy nanocomposite sheets. (Data according to Choi et al. [18].)
10.4 Electrical Conductivity of Nanocomposites j291
viscosity, while in the second method a commercial epoxy resin was used. In both
cases, the carbon fibers were dispersed in the liquid by stirring and sonication at
room temperature. From Figure 10.30, it is clear that the electrical conductivity
increases in the low-viscosity case by more than 10 orders of magnitude over a
concentration range from 0 to 5 wt% carbon fibers, whereas the increase in
conductivity is less significant in the case of the high-viscosity process.
With respect to the amount of material needed to obtain percolation, a significantly more advanced system was introduced by Murphy et al. [19] in which, instead
10
-05
10
-04
10
-03
10
-02
10
-01
reduced weight fraction (p-p c )
10
-04
10
-03
10
-02
10
-01
10
00
10
01
electric
conductivity
[Sm
-1 ]
Figure 10.29 Double logarithmic plot of the
electric conductivity of the material, as
displayed in Figure 10.28, versus the reduced
weight fraction p – p c . The experimental data
follow exactly Eq. (10.14), up to a volume
content of almost 0.1 above the percolation
threshold [17].
0
5
10
15
20
carbon fiber content [wt%]
-16
-12
-8
-4
0
log(conductivity
[Scm
-1 ])
high viscosity
low viscosity
Figure 10.30 Electrical conductivity of carbon nanotube-filled epoxy as a function of fiber loading
for low- and high-viscosity epoxy nanocomposite sheets. (Data according to Choi et al. [18].)
10.4 Electrical Conductivity of Nanocomposites j291