

The percolation threshold and electrical conductivity at saturation level are heavily
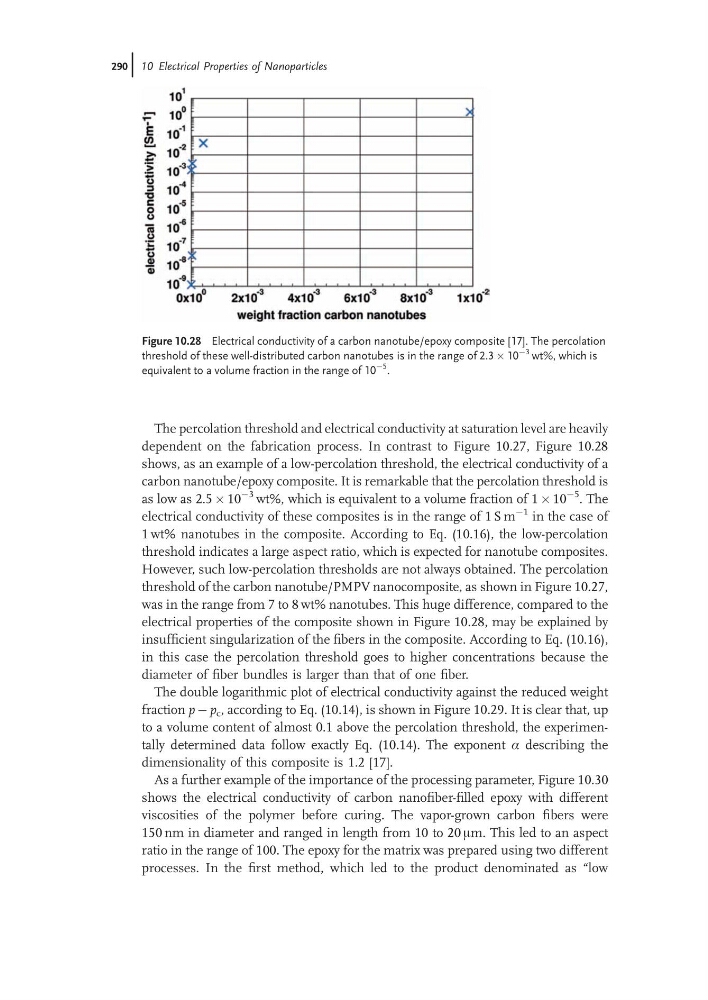
dependent on the fabrication process. In contrast to Figure 10.27, Figure 10.28
shows, as an example of a low-percolation threshold, the electrical conductivity of a
carbon nanotube/epoxy composite. It is remarkable that the percolation threshold is
as low as 2.5 Â 10
À3 wt%, which is equivalent to a volume fraction of 1 Â 10
À5
. The
electrical conductivity of these composites is in the range of 1 S m
À1 in the case of
1 wt% nanotubes in the composite. According to Eq. (10.16), the low-percolation
threshold indicates a large aspect ratio, which is expected for nanotube composites.
However, such low-percolation thresholds are not always obtained. The percolation
threshold of the carbon nanotube/PMPV nanocomposite, as shown in Figure 10.27,
was in the range from 7 to 8 wt% nanotubes. This huge difference, compared to the
electrical properties of the composite shown in Figure 10.28, may be explained by
insufficient singularization of the fibers in the composite. According to Eq. (10.16),
in this case the percolation threshold goes to higher concentrations because the
diameter of fiber bundles is larger than that of one fiber.
The double logarithmic plot of electrical conductivity against the reduced weight
fraction p À p c , according to Eq. (10.14), is shown in Figure 10.29. It is clear that, up
to a volume content of almost 0.1 above the percolation threshold, the experimentally determined data follow exactly Eq. (10.14). The exponent a describing the
dimensionality of this composite is 1.2 [17].
As a further example of the importance of the processing parameter, Figure 10.30
shows the electrical conductivity of carbon nanofiber-filled epoxy with different
viscosities of the polymer before curing. The vapor-grown carbon fibers were
150 nm in diameter and ranged in length from 10 to 20 mm. This led to an aspect
ratio in the range of 100. The epoxy for the matrix was prepared using two different
processes. In the first method, which led to the product denominated as “low
Figure 10.28 Electrical conductivity of a carbon nanotube/epoxy composite [17]. The percolation
threshold of these well-distributed carbon nanotubes is in the range of 2.3 Â 10
À3 wt%, which is
equivalent to a volume fraction in the range of 10
À5 .
290j 10 Electrical Properties of Nanoparticles
dependent on the fabrication process. In contrast to Figure 10.27, Figure 10.28
shows, as an example of a low-percolation threshold, the electrical conductivity of a
carbon nanotube/epoxy composite. It is remarkable that the percolation threshold is
as low as 2.5 Â 10
À3 wt%, which is equivalent to a volume fraction of 1 Â 10
À5
. The
electrical conductivity of these composites is in the range of 1 S m
À1 in the case of
1 wt% nanotubes in the composite. According to Eq. (10.16), the low-percolation
threshold indicates a large aspect ratio, which is expected for nanotube composites.
However, such low-percolation thresholds are not always obtained. The percolation
threshold of the carbon nanotube/PMPV nanocomposite, as shown in Figure 10.27,
was in the range from 7 to 8 wt% nanotubes. This huge difference, compared to the
electrical properties of the composite shown in Figure 10.28, may be explained by
insufficient singularization of the fibers in the composite. According to Eq. (10.16),
in this case the percolation threshold goes to higher concentrations because the
diameter of fiber bundles is larger than that of one fiber.
The double logarithmic plot of electrical conductivity against the reduced weight
fraction p À p c , according to Eq. (10.14), is shown in Figure 10.29. It is clear that, up
to a volume content of almost 0.1 above the percolation threshold, the experimentally determined data follow exactly Eq. (10.14). The exponent a describing the
dimensionality of this composite is 1.2 [17].
As a further example of the importance of the processing parameter, Figure 10.30
shows the electrical conductivity of carbon nanofiber-filled epoxy with different
viscosities of the polymer before curing. The vapor-grown carbon fibers were
150 nm in diameter and ranged in length from 10 to 20 mm. This led to an aspect
ratio in the range of 100. The epoxy for the matrix was prepared using two different
processes. In the first method, which led to the product denominated as “low
Figure 10.28 Electrical conductivity of a carbon nanotube/epoxy composite [17]. The percolation
threshold of these well-distributed carbon nanotubes is in the range of 2.3 Â 10
À3 wt%, which is
equivalent to a volume fraction in the range of 10
À5 .
290j 10 Electrical Properties of Nanoparticles