

when the composition is clearly in the sphalerite, one-phase field. CdSe does not
show such a maximum of the absorption and therefore it is not surprising that
neither in the wurtzite one-phase field, nor in the wurtzite two-phase field, is this
maximum observed.
In the two-phase area, at a Se/Te ratio of about 1, a minimum of the absorption is
observed. As in the two-phase field, the same concentration is distributed into two
different species of particles; one may assume the presence of extremely small
particles in this field.
Furthermore, the spectra in Figure 9.39b show that the absorption decreases at
higher concentrations. The relative amounts of the constituents of the nanomaterial
used for Figure 9.39b were directed to be CdSe 0.2 Te 0.8 and therefore lay clearly in the
sphalerite one-phase field. It is of interest to note that the same maximum close to
570 nm is observed only at the lowest concentration; consequently, only at low
concentrations of CdSe 0.2 Te 0.8 nanoparticles will the absorption spectrum be similar
to that of CdTe nanoparticles. In contrast, for other CdSe x Te 1Àx solid solutions, this
maximum is missing, independently of a concentration above 0.5 wt%. It is most
likely that, only under these conditions, CdSe 0.2 Te 0.8 and CdTe nanoparticles are
similar in structure.
When considering photoluminescence in glass, great care must be taken when
associating a mechanism, as luminescence is not necessarily connected to nanoparticles and to quantum confinement. In this respect, a very instructive example for
the possibility of such an erroneous attribution is provided in Figure 9.40.
Here, the experiments were performed on thin silica glass films doped with
1 mol% silver, prepared by sol–gel dipping of substrates, the sheets being either
of pure silica glass or a soda-lime glass. After depositing, the films were dried and
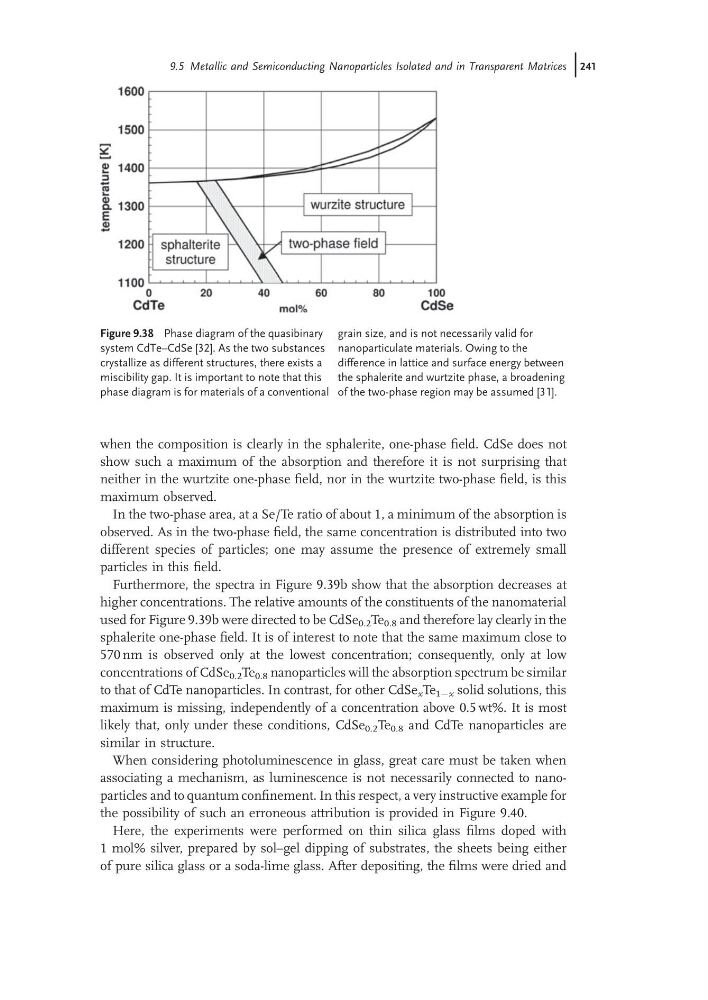
Figure 9.38 Phase diagram of the quasibinary
system CdTe–CdSe [32]. As the two substances
crystallize as different structures, there exists a
miscibility gap. It is important to note that this
phase diagram is for materials of a conventional
grain size, and is not necessarily valid for
nanoparticulate materials. Owing to the
difference in lattice and surface energy between
the sphalerite and wurtzite phase, a broadening
of the two-phase region may be assumed [31].
9.5 Metallic and Semiconducting Nanoparticles Isolated and in Transparent Matrices j241
show such a maximum of the absorption and therefore it is not surprising that
neither in the wurtzite one-phase field, nor in the wurtzite two-phase field, is this
maximum observed.
In the two-phase area, at a Se/Te ratio of about 1, a minimum of the absorption is
observed. As in the two-phase field, the same concentration is distributed into two
different species of particles; one may assume the presence of extremely small
particles in this field.
Furthermore, the spectra in Figure 9.39b show that the absorption decreases at
higher concentrations. The relative amounts of the constituents of the nanomaterial
used for Figure 9.39b were directed to be CdSe 0.2 Te 0.8 and therefore lay clearly in the
sphalerite one-phase field. It is of interest to note that the same maximum close to
570 nm is observed only at the lowest concentration; consequently, only at low
concentrations of CdSe 0.2 Te 0.8 nanoparticles will the absorption spectrum be similar
to that of CdTe nanoparticles. In contrast, for other CdSe x Te 1Àx solid solutions, this
maximum is missing, independently of a concentration above 0.5 wt%. It is most
likely that, only under these conditions, CdSe 0.2 Te 0.8 and CdTe nanoparticles are
similar in structure.
When considering photoluminescence in glass, great care must be taken when
associating a mechanism, as luminescence is not necessarily connected to nanoparticles and to quantum confinement. In this respect, a very instructive example for
the possibility of such an erroneous attribution is provided in Figure 9.40.
Here, the experiments were performed on thin silica glass films doped with
1 mol% silver, prepared by sol–gel dipping of substrates, the sheets being either
of pure silica glass or a soda-lime glass. After depositing, the films were dried and
Figure 9.38 Phase diagram of the quasibinary
system CdTe–CdSe [32]. As the two substances
crystallize as different structures, there exists a
miscibility gap. It is important to note that this
phase diagram is for materials of a conventional
grain size, and is not necessarily valid for
nanoparticulate materials. Owing to the
difference in lattice and surface energy between
the sphalerite and wurtzite phase, a broadening
of the two-phase region may be assumed [31].
9.5 Metallic and Semiconducting Nanoparticles Isolated and in Transparent Matrices j241