

to significant changes in the emission spectra. Zinc oxide (ZnO) is a good example of
the formation of dipolar nanoparticles [11] that, in the excited state, exhibit a dipole
moment leading to a permanent dipole-induced dipole interaction. This significantly influences the emission wavelength of the composites, and in this situation
the size-dependency of the emitted wavelength is no longer than d
2 ; rather, a
dependency on d
3 was theoretically predicted and verified experimentally [11,12]. As
an example, the emission wavelength of ZnO coated with poly(methyl methacrylate)
(PMMA) as a function of particle size is shown in Figure 9.17a. However, perhaps
more interesting is the rectified plot shown in Figure 9.17b, where the emission
wavelength is plotted according to considerations of Monticone et al. [11] versus d
À3
.
Again, the minor deviations between the experimental and fitted lined are due to
experimental variation, notably in relation to the particle size. (It should be noted
here that, in contrast to Figure 9.16, the ordinate is inverse wavelength rather than
energy, these being proportional quantities.)
Further materials used for exploiting the quantum confinement phenomena
include CdSe, CdS, GaAs, and GaN. In most cases, these nanoparticles are applied
as isolated particles, especially in biotechnology, or as thin films.
In many cases, the properties of luminescent material depend heavily on the
environment and the method of synthesis. As a typical example, the photoluminescence spectra of PbS in polystyrene in the infrared (IR) (Figure 9.18a)
and visible range (Figure 9.18b) are provided here. Emission in the IR range was
excited by 532-nm photons, whereas the excitation wavelength for emission in the
visible range was 325 nm. Apart from the formation of PbS in polystyrene, the
applied process of synthesis inherently led to the formation of some PbSO 3 . The
occurrence of this byproduct was identified using spectroscopic methods; a
noncritical view of the results of luminescence measurements conveys the
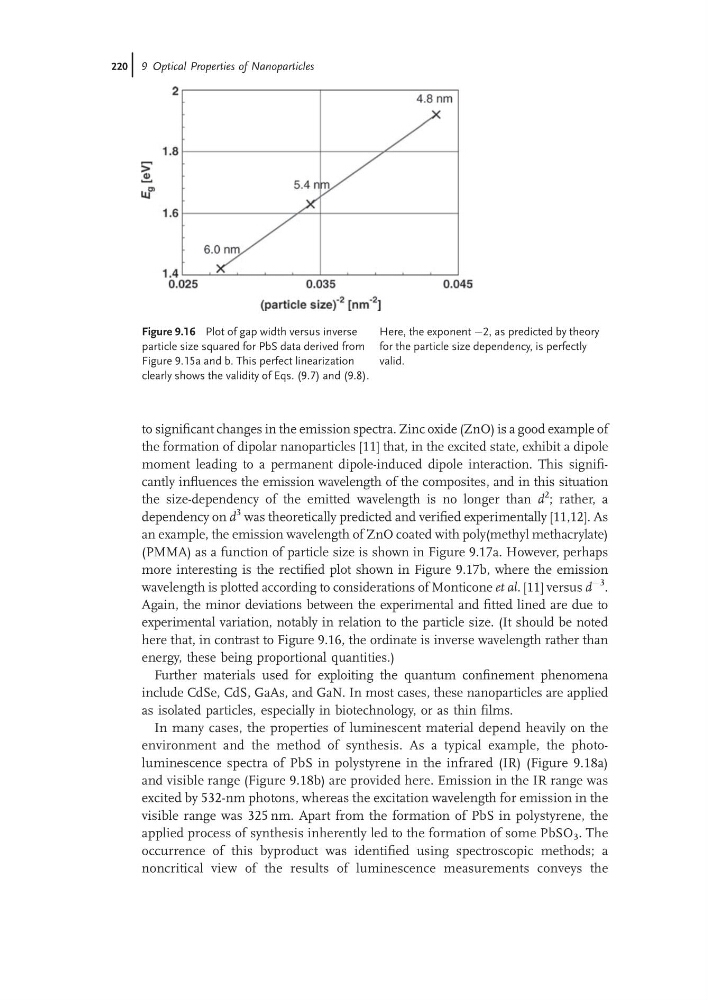
Figure 9.16 Plot of gap width versus inverse
particle size squared for PbS data derived from
Figure 9.15a and b. This perfect linearization
clearly shows the validity of Eqs. (9.7) and (9.8).
Here, the exponent À2, as predicted by theory
for the particle size dependency, is perfectly
valid.
220j 9 Optical Properties of Nanoparticles
the formation of dipolar nanoparticles [11] that, in the excited state, exhibit a dipole
moment leading to a permanent dipole-induced dipole interaction. This significantly influences the emission wavelength of the composites, and in this situation
the size-dependency of the emitted wavelength is no longer than d
2 ; rather, a
dependency on d
3 was theoretically predicted and verified experimentally [11,12]. As
an example, the emission wavelength of ZnO coated with poly(methyl methacrylate)
(PMMA) as a function of particle size is shown in Figure 9.17a. However, perhaps
more interesting is the rectified plot shown in Figure 9.17b, where the emission
wavelength is plotted according to considerations of Monticone et al. [11] versus d
À3
.
Again, the minor deviations between the experimental and fitted lined are due to
experimental variation, notably in relation to the particle size. (It should be noted
here that, in contrast to Figure 9.16, the ordinate is inverse wavelength rather than
energy, these being proportional quantities.)
Further materials used for exploiting the quantum confinement phenomena
include CdSe, CdS, GaAs, and GaN. In most cases, these nanoparticles are applied
as isolated particles, especially in biotechnology, or as thin films.
In many cases, the properties of luminescent material depend heavily on the
environment and the method of synthesis. As a typical example, the photoluminescence spectra of PbS in polystyrene in the infrared (IR) (Figure 9.18a)
and visible range (Figure 9.18b) are provided here. Emission in the IR range was
excited by 532-nm photons, whereas the excitation wavelength for emission in the
visible range was 325 nm. Apart from the formation of PbS in polystyrene, the
applied process of synthesis inherently led to the formation of some PbSO 3 . The
occurrence of this byproduct was identified using spectroscopic methods; a
noncritical view of the results of luminescence measurements conveys the
Figure 9.16 Plot of gap width versus inverse
particle size squared for PbS data derived from
Figure 9.15a and b. This perfect linearization
clearly shows the validity of Eqs. (9.7) and (9.8).
Here, the exponent À2, as predicted by theory
for the particle size dependency, is perfectly
valid.
220j 9 Optical Properties of Nanoparticles