

distance between directly adjacent particles is clearly defined are produced as coated
nanoparticles. The sample used to measure the magnetization curve shown in
Figure 8.17a consisted of c-Fe 2 O 3 particles coated with PMMA and pressed into a
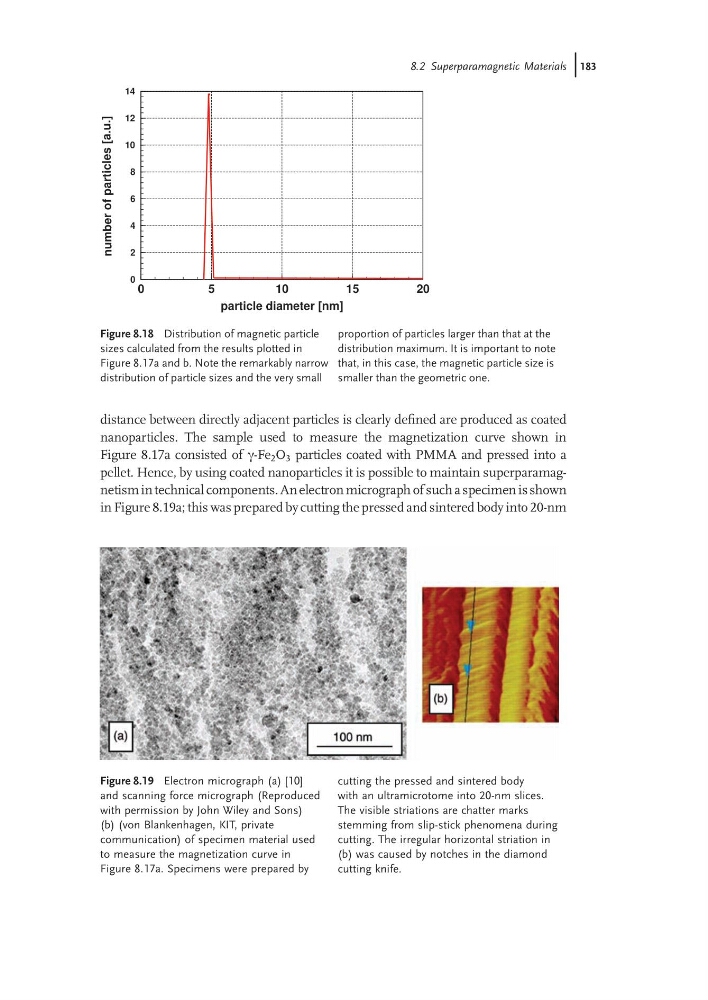
pellet. Hence, by using coated nanoparticles it is possible to maintain superparamagnetism in technical components. An electron micrograph of such a specimen is shown
in Figure 8.19a; this was prepared by cutting the pressed and sintered body into 20-nm
0
5
10
15
20
particle diameter [nm]
0
2
4
6
8
10
12
14
number
of
particles
[a.u.]
Figure 8.18 Distribution of magnetic particle
sizes calculated from the results plotted in
Figure 8.17a and b. Note the remarkably narrow
distribution of particle sizes and the very small
proportion of particles larger than that at the
distribution maximum. It is important to note
that, in this case, the magnetic particle size is
smaller than the geometric one.
Figure 8.19 Electron micrograph (a) [10]
and scanning force micrograph (Reproduced
with permission by John Wiley and Sons)
(b) (von Blankenhagen, KIT, private
communication) of specimen material used
to measure the magnetization curve in
Figure 8.17a. Specimens were prepared by
cutting the pressed and sintered body
with an ultramicrotome into 20-nm slices.
The visible striations are chatter marks
stemming from slip-stick phenomena during
cutting. The irregular horizontal striation in
(b) was caused by notches in the diamond
cutting knife.
8.2 Superparamagnetic Materials j183
nanoparticles. The sample used to measure the magnetization curve shown in
Figure 8.17a consisted of c-Fe 2 O 3 particles coated with PMMA and pressed into a
pellet. Hence, by using coated nanoparticles it is possible to maintain superparamagnetism in technical components. An electron micrograph of such a specimen is shown
in Figure 8.19a; this was prepared by cutting the pressed and sintered body into 20-nm
0
5
10
15
20
particle diameter [nm]
0
2
4
6
8
10
12
14
number
of
particles
[a.u.]
Figure 8.18 Distribution of magnetic particle
sizes calculated from the results plotted in
Figure 8.17a and b. Note the remarkably narrow
distribution of particle sizes and the very small
proportion of particles larger than that at the
distribution maximum. It is important to note
that, in this case, the magnetic particle size is
smaller than the geometric one.
Figure 8.19 Electron micrograph (a) [10]
and scanning force micrograph (Reproduced
with permission by John Wiley and Sons)
(b) (von Blankenhagen, KIT, private
communication) of specimen material used
to measure the magnetization curve in
Figure 8.17a. Specimens were prepared by
cutting the pressed and sintered body
with an ultramicrotome into 20-nm slices.
The visible striations are chatter marks
stemming from slip-stick phenomena during
cutting. The irregular horizontal striation in
(b) was caused by notches in the diamond
cutting knife.
8.2 Superparamagnetic Materials j183