

As expected from Eq. (8.6), the relationship is essentially linear, and the equation
is well suited to the determination of blocking temperature and coercivity at 0 K. By
using a linear fit, based on the experimental data of Figure 8.12, T B was shown to be
119.5 K, while H C0 was 0.0337 T.
The magnetization curves depicted in Figure 8.9 are related only to the time
constant of the measuring device which, in most cases, is around 100 s. In order to
define superparamagnetism the time constants are crucial; thus, to prove superparamagnetism with regard to shorter time constants, other more sophisticated
methods are necessary.
When comparing the magnetization curves plotted in Figure 8.9 with those of
materials with grain sizes in the micrometer region, significantly lower values of
saturation magnetization are obtained. For c-Fe 2 O 3 , in theory, a saturation magnetization of around 75 A m
2 kg
À1 is expected; however, for nanoparticles, values down
to 10 A m
2 kg
À1 are observed. The reduction of saturation magnetization observed in
nanoparticles is a surface phenomenon. At the surface of magnetic materials spin
canting phenomena can be observed and this leads to a surface layer with very small
saturation magnetization. Simply speaking, at the surface of magnetic particles the
spins are not as well ordered as are observed in the interior [4]. As the surface/
volume ratios of nanoparticles are larger by a few orders of magnitude than those of
conventional materials, the contribution of spin canting at the surface to the
magnetization is of increasing importance as it causes a significant reduction in
saturation magnetization.
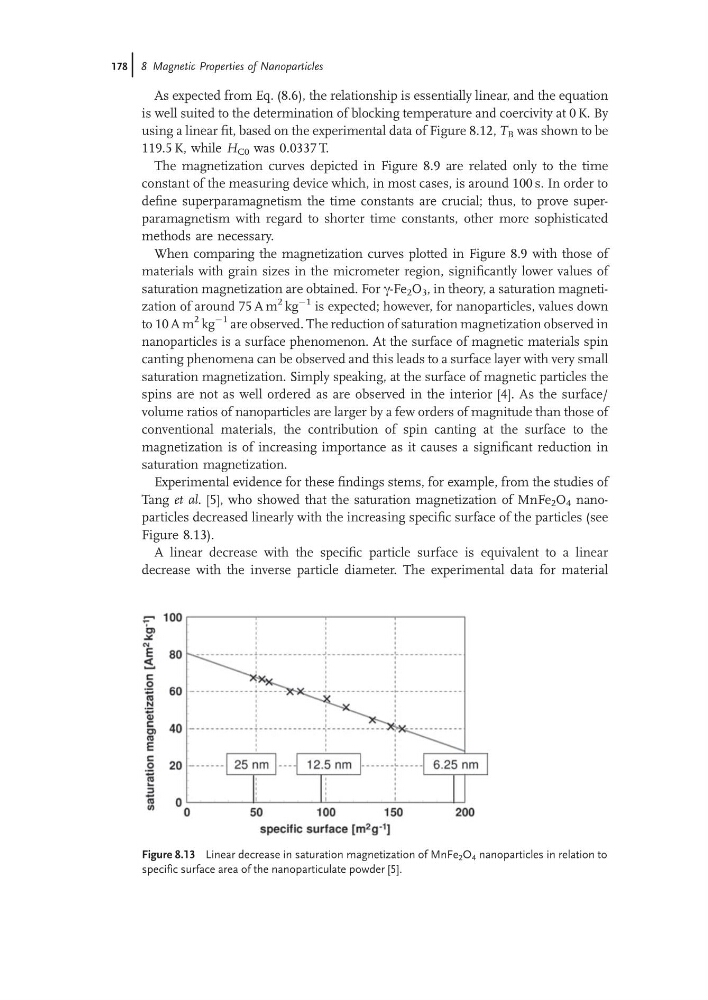
Experimental evidence for these findings stems, for example, from the studies of
Tang et al. [5], who showed that the saturation magnetization of MnFe 2 O 4 nanoparticles decreased linearly with the increasing specific surface of the particles (see
Figure 8.13).
A linear decrease with the specific particle surface is equivalent to a linear
decrease with the inverse particle diameter. The experimental data for material
Figure 8.13 Linear decrease in saturation magnetization of MnFe 2 O 4 nanoparticles in relation to
specific surface area of the nanoparticulate powder [5].
178j 8 Magnetic Properties of Nanoparticles
is well suited to the determination of blocking temperature and coercivity at 0 K. By
using a linear fit, based on the experimental data of Figure 8.12, T B was shown to be
119.5 K, while H C0 was 0.0337 T.
The magnetization curves depicted in Figure 8.9 are related only to the time
constant of the measuring device which, in most cases, is around 100 s. In order to
define superparamagnetism the time constants are crucial; thus, to prove superparamagnetism with regard to shorter time constants, other more sophisticated
methods are necessary.
When comparing the magnetization curves plotted in Figure 8.9 with those of
materials with grain sizes in the micrometer region, significantly lower values of
saturation magnetization are obtained. For c-Fe 2 O 3 , in theory, a saturation magnetization of around 75 A m
2 kg
À1 is expected; however, for nanoparticles, values down
to 10 A m
2 kg
À1 are observed. The reduction of saturation magnetization observed in
nanoparticles is a surface phenomenon. At the surface of magnetic materials spin
canting phenomena can be observed and this leads to a surface layer with very small
saturation magnetization. Simply speaking, at the surface of magnetic particles the
spins are not as well ordered as are observed in the interior [4]. As the surface/
volume ratios of nanoparticles are larger by a few orders of magnitude than those of
conventional materials, the contribution of spin canting at the surface to the
magnetization is of increasing importance as it causes a significant reduction in
saturation magnetization.
Experimental evidence for these findings stems, for example, from the studies of
Tang et al. [5], who showed that the saturation magnetization of MnFe 2 O 4 nanoparticles decreased linearly with the increasing specific surface of the particles (see
Figure 8.13).
A linear decrease with the specific particle surface is equivalent to a linear
decrease with the inverse particle diameter. The experimental data for material
Figure 8.13 Linear decrease in saturation magnetization of MnFe 2 O 4 nanoparticles in relation to
specific surface area of the nanoparticulate powder [5].
178j 8 Magnetic Properties of Nanoparticles