

superparamagnetism. Occasionally, the properties of superparamagnetic materials
are given as a function of a temperature-independent magnetic quantity
a ¼ mH=kT, called the “reduced magnetic field.”
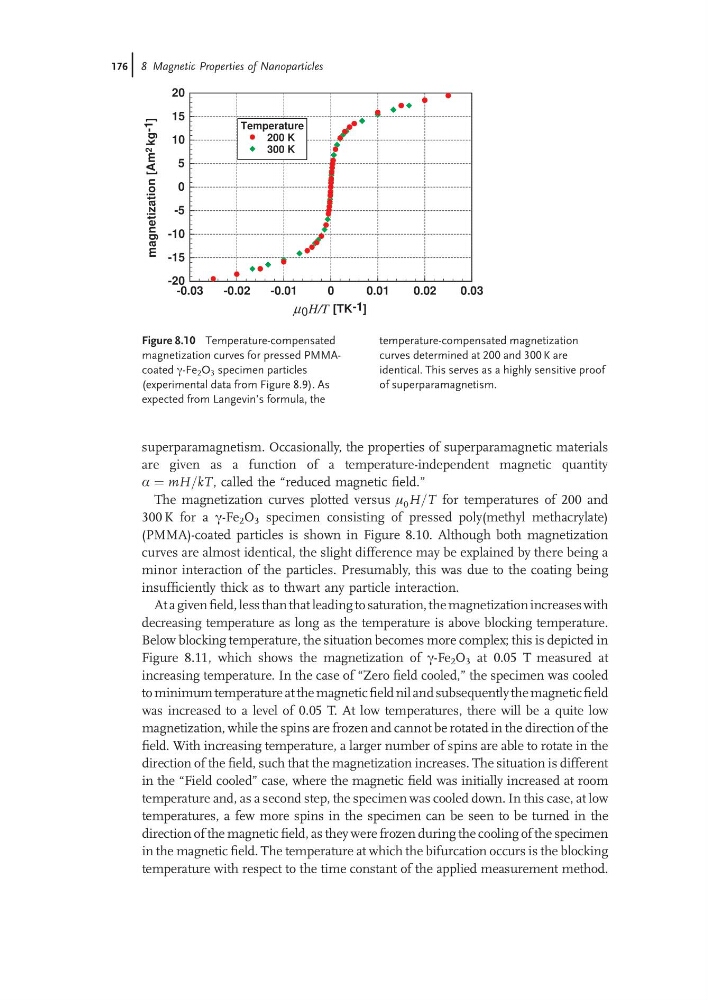
The magnetization curves plotted versus m 0 H=T for temperatures of 200 and
300 K for a c-Fe 2 O 3 specimen consisting of pressed poly(methyl methacrylate)
(PMMA)-coated particles is shown in Figure 8.10. Although both magnetization
curves are almost identical, the slight difference may be explained by there being a
minor interaction of the particles. Presumably, this was due to the coating being
insufficiently thick as to thwart any particle interaction.
At a given field, less than that leading to saturation, the magnetization increases with
decreasing temperature as long as the temperature is above blocking temperature.
Below blocking temperature, the situation becomes more complex; this is depicted in
Figure 8.11, which shows the magnetization of c-Fe 2 O 3 at 0.05 T measured at
increasing temperature. In the case of “Zero field cooled,” the specimen was cooled
to minimum temperature at the magnetic field nil and subsequently the magnetic field
was increased to a level of 0.05 T. At low temperatures, there will be a quite low
magnetization, while the spins are frozen and cannot be rotated in the direction of the
field. With increasing temperature, a larger number of spins are able to rotate in the
direction of the field, such that the magnetization increases. The situation is different
in the “Field cooled” case, where the magnetic field was initially increased at room
temperature and, as a second step, the specimen was cooled down. In this case, at low
temperatures, a few more spins in the specimen can be seen to be turned in the
direction of the magnetic field, as they were frozen during the cooling of the specimen
in the magnetic field. The temperature at which the bifurcation occurs is the blocking
temperature with respect to the time constant of the applied measurement method.
-0.03
-0.02
-0.01
0
0.01
0.02
0.03
μ 0 H/T [TK -1 ]
-20
-15
-10
-5
0
5
10
15
20
magnetization
[Am
2 kg
-1 ]
Temperature
200 K
300 K
Figure 8.10 Temperature-compensated
magnetization curves for pressed PMMAcoated c-Fe 2 O 3 specimen particles
(experimental data from Figure 8.9). As
expected from Langevin’s formula, the
temperature-compensated magnetization
curves determined at 200 and 300 K are
identical. This serves as a highly sensitive proof
of superparamagnetism.
176j 8 Magnetic Properties of Nanoparticles
are given as a function of a temperature-independent magnetic quantity
a ¼ mH=kT, called the “reduced magnetic field.”
The magnetization curves plotted versus m 0 H=T for temperatures of 200 and
300 K for a c-Fe 2 O 3 specimen consisting of pressed poly(methyl methacrylate)
(PMMA)-coated particles is shown in Figure 8.10. Although both magnetization
curves are almost identical, the slight difference may be explained by there being a
minor interaction of the particles. Presumably, this was due to the coating being
insufficiently thick as to thwart any particle interaction.
At a given field, less than that leading to saturation, the magnetization increases with
decreasing temperature as long as the temperature is above blocking temperature.
Below blocking temperature, the situation becomes more complex; this is depicted in
Figure 8.11, which shows the magnetization of c-Fe 2 O 3 at 0.05 T measured at
increasing temperature. In the case of “Zero field cooled,” the specimen was cooled
to minimum temperature at the magnetic field nil and subsequently the magnetic field
was increased to a level of 0.05 T. At low temperatures, there will be a quite low
magnetization, while the spins are frozen and cannot be rotated in the direction of the
field. With increasing temperature, a larger number of spins are able to rotate in the
direction of the field, such that the magnetization increases. The situation is different
in the “Field cooled” case, where the magnetic field was initially increased at room
temperature and, as a second step, the specimen was cooled down. In this case, at low
temperatures, a few more spins in the specimen can be seen to be turned in the
direction of the magnetic field, as they were frozen during the cooling of the specimen
in the magnetic field. The temperature at which the bifurcation occurs is the blocking
temperature with respect to the time constant of the applied measurement method.
-0.03
-0.02
-0.01
0
0.01
0.02
0.03
μ 0 H/T [TK -1 ]
-20
-15
-10
-5
0
5
10
15
20
magnetization
[Am
2 kg
-1 ]
Temperature
200 K
300 K
Figure 8.10 Temperature-compensated
magnetization curves for pressed PMMAcoated c-Fe 2 O 3 specimen particles
(experimental data from Figure 8.9). As
expected from Langevin’s formula, the
temperature-compensated magnetization
curves determined at 200 and 300 K are
identical. This serves as a highly sensitive proof
of superparamagnetism.
176j 8 Magnetic Properties of Nanoparticles