

c solid ¼ 1:55 À 1:4 Â 10
À4
T and c liquid ¼ 1:34 À 1:6 Â 10
À4
T (with c in J m
À2 and T
in K). For all the other thermodynamic constants, standard values were taken. The
calculations resulted in an enthalpy of transformation DU trans ¼ 13 230 J mol
À1 and to
an entropy of transformation DS trans ¼ 9:97 JK
À1 mol
À1 . The fractions of solid and
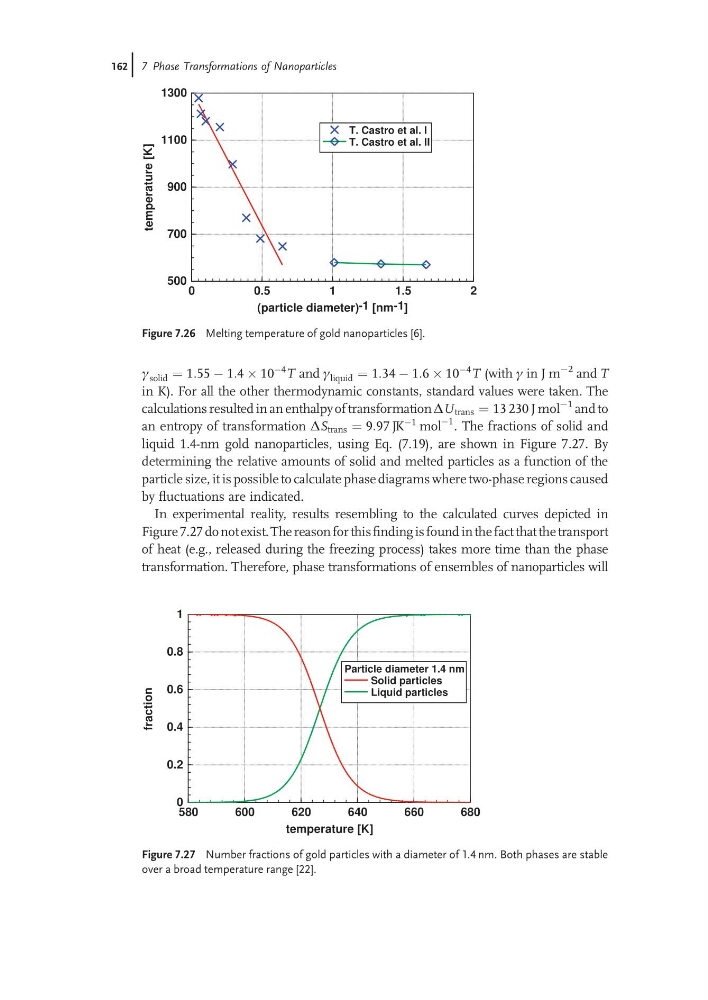
liquid 1.4-nm gold nanoparticles, using Eq. (7.19), are shown in Figure 7.27. By
determining the relative amounts of solid and melted particles as a function of the
particle size, it is possible to calculate phase diagrams where two-phase regions caused
by fluctuations are indicated.
In experimental reality, results resembling to the calculated curves depicted in
Figure 7.27 do not exist. The reason for this finding is found in the fact that the transport
of heat (e.g., released during the freezing process) takes more time than the phase
transformation. Therefore, phase transformations of ensembles of nanoparticles will
0
0.5
1
1.5
2
(particle diameter) -1 [nm -1 ]
500
700
900
1100
1300
temperature
[K]
T. Castro et al. I
T. Castro et al. II
Figure 7.26 Melting temperature of gold nanoparticles [6].
580
600
620
640
660
680
temperature [K]
0
0.2
0.4
0.6
0.8
1
fraction
Particle diameter 1.4 nm
Solid particles
Liquid particles
Figure 7.27 Number fractions of gold particles with a diameter of 1.4 nm. Both phases are stable
over a broad temperature range [22].
162j 7 Phase Transformations of Nanoparticles
À4
T and c liquid ¼ 1:34 À 1:6 Â 10
À4
T (with c in J m
À2 and T
in K). For all the other thermodynamic constants, standard values were taken. The
calculations resulted in an enthalpy of transformation DU trans ¼ 13 230 J mol
À1 and to
an entropy of transformation DS trans ¼ 9:97 JK
À1 mol
À1 . The fractions of solid and
liquid 1.4-nm gold nanoparticles, using Eq. (7.19), are shown in Figure 7.27. By
determining the relative amounts of solid and melted particles as a function of the
particle size, it is possible to calculate phase diagrams where two-phase regions caused
by fluctuations are indicated.
In experimental reality, results resembling to the calculated curves depicted in
Figure 7.27 do not exist. The reason for this finding is found in the fact that the transport
of heat (e.g., released during the freezing process) takes more time than the phase
transformation. Therefore, phase transformations of ensembles of nanoparticles will
0
0.5
1
1.5
2
(particle diameter) -1 [nm -1 ]
500
700
900
1100
1300
temperature
[K]
T. Castro et al. I
T. Castro et al. II
Figure 7.26 Melting temperature of gold nanoparticles [6].
580
600
620
640
660
680
temperature [K]
0
0.2
0.4
0.6
0.8
1
fraction
Particle diameter 1.4 nm
Solid particles
Liquid particles
Figure 7.27 Number fractions of gold particles with a diameter of 1.4 nm. Both phases are stable
over a broad temperature range [22].
162j 7 Phase Transformations of Nanoparticles