

These tiny crystals are visible in frames (c) and (m); however, this is not to say that
they are the only crystals and do not appear in the other frames. It is possible – and also
highly probable – that their orientation is such that the lattice fringes are not observable.
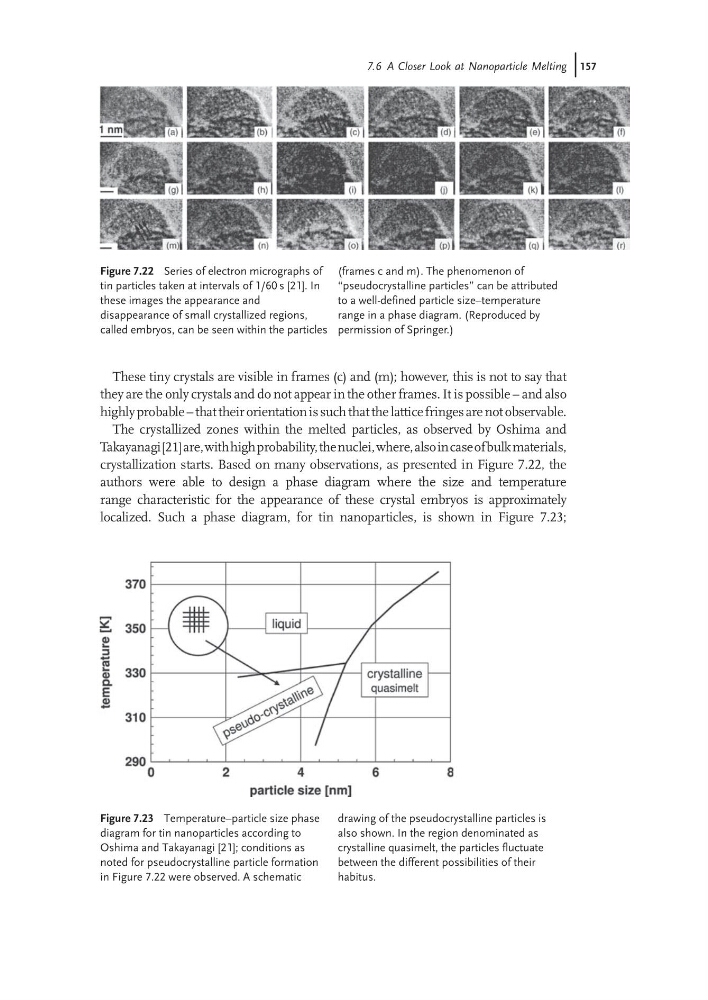
The crystallized zones within the melted particles, as observed by Oshima and
Takayanagi[21]are,withhighprobability,thenuclei,where,alsoincaseofbulkmaterials,
crystallization starts. Based on many observations, as presented in Figure 7.22, the
authors were able to design a phase diagram where the size and temperature
range characteristic for the appearance of these crystal embryos is approximately
localized. Such a phase diagram, for tin nanoparticles, is shown in Figure 7.23;
Figure 7.22 Series of electron micrographs of
tin particles taken at intervals of 1/60 s [21]. In
these images the appearance and
disappearance of small crystallized regions,
called embryos, can be seen within the particles
(frames c and m). The phenomenon of
“pseudocrystalline particles” can be attributed
to a well-defined particle size–temperature
range in a phase diagram. (Reproduced by
permission of Springer.)
Figure 7.23 Temperature–particle size phase
diagram for tin nanoparticles according to
Oshima and Takayanagi [21]; conditions as
noted for pseudocrystalline particle formation
in Figure 7.22 were observed. A schematic
drawing of the pseudocrystalline particles is
also shown. In the region denominated as
crystalline quasimelt, the particles fluctuate
between the different possibilities of their
habitus.
7.6 A Closer Look at Nanoparticle Melting j157
they are the only crystals and do not appear in the other frames. It is possible – and also
highly probable – that their orientation is such that the lattice fringes are not observable.
The crystallized zones within the melted particles, as observed by Oshima and
Takayanagi[21]are,withhighprobability,thenuclei,where,alsoincaseofbulkmaterials,
crystallization starts. Based on many observations, as presented in Figure 7.22, the
authors were able to design a phase diagram where the size and temperature
range characteristic for the appearance of these crystal embryos is approximately
localized. Such a phase diagram, for tin nanoparticles, is shown in Figure 7.23;
Figure 7.22 Series of electron micrographs of
tin particles taken at intervals of 1/60 s [21]. In
these images the appearance and
disappearance of small crystallized regions,
called embryos, can be seen within the particles
(frames c and m). The phenomenon of
“pseudocrystalline particles” can be attributed
to a well-defined particle size–temperature
range in a phase diagram. (Reproduced by
permission of Springer.)
Figure 7.23 Temperature–particle size phase
diagram for tin nanoparticles according to
Oshima and Takayanagi [21]; conditions as
noted for pseudocrystalline particle formation
in Figure 7.22 were observed. A schematic
drawing of the pseudocrystalline particles is
also shown. In the region denominated as
crystalline quasimelt, the particles fluctuate
between the different possibilities of their
habitus.
7.6 A Closer Look at Nanoparticle Melting j157