

of images suggests a thermal instability. Clearly, the difference in free energy of
the different particle shapes is so small that they are energetically more or less
equivalent.
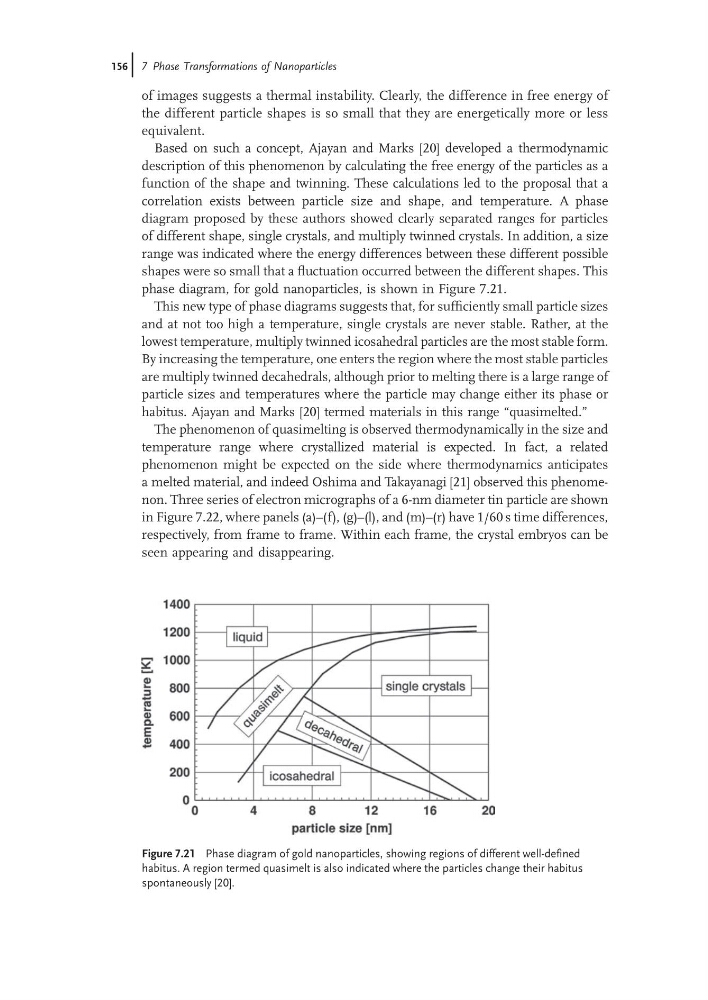
Based on such a concept, Ajayan and Marks [20] developed a thermodynamic
description of this phenomenon by calculating the free energy of the particles as a
function of the shape and twinning. These calculations led to the proposal that a
correlation exists between particle size and shape, and temperature. A phase
diagram proposed by these authors showed clearly separated ranges for particles
of different shape, single crystals, and multiply twinned crystals. In addition, a size
range was indicated where the energy differences between these different possible
shapes were so small that a fluctuation occurred between the different shapes. This
phase diagram, for gold nanoparticles, is shown in Figure 7.21.
This new type of phase diagrams suggests that, for sufficiently small particle sizes
and at not too high a temperature, single crystals are never stable. Rather, at the
lowest temperature, multiply twinned icosahedral particles are the most stable form.
By increasing the temperature, one enters the region where the most stable particles
are multiply twinned decahedrals, although prior to melting there is a large range of
particle sizes and temperatures where the particle may change either its phase or
habitus. Ajayan and Marks [20] termed materials in this range “quasimelted.”
The phenomenon of quasimelting is observed thermodynamically in the size and
temperature range where crystallized material is expected. In fact, a related
phenomenon might be expected on the side where thermodynamics anticipates
a melted material, and indeed Oshima and Takayanagi [21] observed this phenomenon. Three series of electron micrographs of a 6-nm diameter tin particle are shown
in Figure 7.22, where panels (a)–(f), (g)–(l), and (m)–(r) have 1/60 s time differences,
respectively, from frame to frame. Within each frame, the crystal embryos can be
seen appearing and disappearing.
Figure 7.21 Phase diagram of gold nanoparticles, showing regions of different well-defined
habitus. A region termed quasimelt is also indicated where the particles change their habitus
spontaneously [20].
156j 7 Phase Transformations of Nanoparticles
the different particle shapes is so small that they are energetically more or less
equivalent.
Based on such a concept, Ajayan and Marks [20] developed a thermodynamic
description of this phenomenon by calculating the free energy of the particles as a
function of the shape and twinning. These calculations led to the proposal that a
correlation exists between particle size and shape, and temperature. A phase
diagram proposed by these authors showed clearly separated ranges for particles
of different shape, single crystals, and multiply twinned crystals. In addition, a size
range was indicated where the energy differences between these different possible
shapes were so small that a fluctuation occurred between the different shapes. This
phase diagram, for gold nanoparticles, is shown in Figure 7.21.
This new type of phase diagrams suggests that, for sufficiently small particle sizes
and at not too high a temperature, single crystals are never stable. Rather, at the
lowest temperature, multiply twinned icosahedral particles are the most stable form.
By increasing the temperature, one enters the region where the most stable particles
are multiply twinned decahedrals, although prior to melting there is a large range of
particle sizes and temperatures where the particle may change either its phase or
habitus. Ajayan and Marks [20] termed materials in this range “quasimelted.”
The phenomenon of quasimelting is observed thermodynamically in the size and
temperature range where crystallized material is expected. In fact, a related
phenomenon might be expected on the side where thermodynamics anticipates
a melted material, and indeed Oshima and Takayanagi [21] observed this phenomenon. Three series of electron micrographs of a 6-nm diameter tin particle are shown
in Figure 7.22, where panels (a)–(f), (g)–(l), and (m)–(r) have 1/60 s time differences,
respectively, from frame to frame. Within each frame, the crystal embryos can be
seen appearing and disappearing.
Figure 7.21 Phase diagram of gold nanoparticles, showing regions of different well-defined
habitus. A region termed quasimelt is also indicated where the particles change their habitus
spontaneously [20].
156j 7 Phase Transformations of Nanoparticles