

rather liquid-like structure of the surface of small nanoparticles, one may expect a
reduced difference of the surface energy between the solid and the liquid state.
From the examples given above, it seems clear that, as with many other phase
transitions, the melting of nanoparticles is a gradual rather than discontinuous
process. This is consistent with the experimental determination of the melting point
of lead nanoparticles [12] and the transition from the cubic to tetragonal phase of
BaTiO 3 [17]. However, despite this being an extremely successful way of describing
and interpreting phase transitions, it is important to realize that the order parameter
M is a mathematical construct that is dependent on an external parameter – the
correlation length – which is chosen freely to fit the experimental data.
Although until now those considerations that have been made were purely thermodynamic in nature, nanoparticles are so small that thermal fluctuations are in fact
observed. Typical examples of these phenomena are superparamagnetism and its
analog, superferroelectricity (see Section 8.1), and electron microscopy studies on the
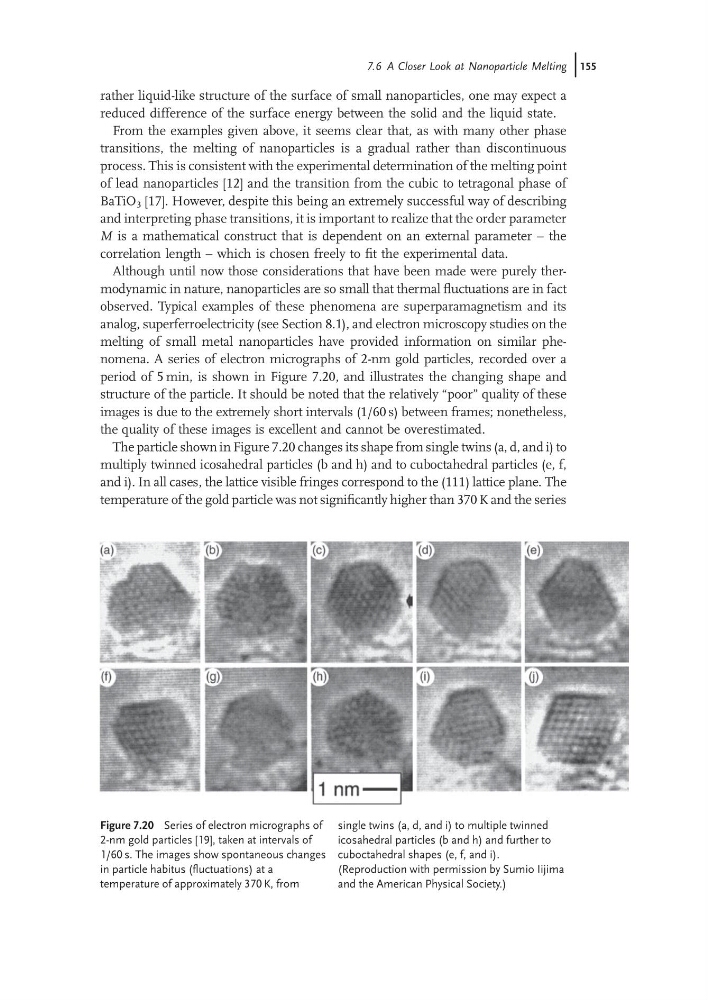
melting of small metal nanoparticles have provided information on similar phenomena. A series of electron micrographs of 2-nm gold particles, recorded over a
period of 5 min, is shown in Figure 7.20, and illustrates the changing shape and
structure of the particle. It should be noted that the relatively “poor” quality of these
images is due to the extremely short intervals (1/60 s) between frames; nonetheless,
the quality of these images is excellent and cannot be overestimated.
The particle shown in Figure 7.20 changes its shape from single twins (a, d, and i) to
multiply twinned icosahedral particles (b and h) and to cuboctahedral particles (e, f,
and i). In all cases, the lattice visible fringes correspond to the (111) lattice plane. The
temperature of the gold particle was not significantly higher than 370 K and the series
Figure 7.20 Series of electron micrographs of
2-nm gold particles [19], taken at intervals of
1/60 s. The images show spontaneous changes
in particle habitus (fluctuations) at a
temperature of approximately 370 K, from
single twins (a, d, and i) to multiple twinned
icosahedral particles (b and h) and further to
cuboctahedral shapes (e, f, and i).
(Reproduction with permission by Sumio Iijima
and the American Physical Society.)
7.6 A Closer Look at Nanoparticle Melting j155
reduced difference of the surface energy between the solid and the liquid state.
From the examples given above, it seems clear that, as with many other phase
transitions, the melting of nanoparticles is a gradual rather than discontinuous
process. This is consistent with the experimental determination of the melting point
of lead nanoparticles [12] and the transition from the cubic to tetragonal phase of
BaTiO 3 [17]. However, despite this being an extremely successful way of describing
and interpreting phase transitions, it is important to realize that the order parameter
M is a mathematical construct that is dependent on an external parameter – the
correlation length – which is chosen freely to fit the experimental data.
Although until now those considerations that have been made were purely thermodynamic in nature, nanoparticles are so small that thermal fluctuations are in fact
observed. Typical examples of these phenomena are superparamagnetism and its
analog, superferroelectricity (see Section 8.1), and electron microscopy studies on the
melting of small metal nanoparticles have provided information on similar phenomena. A series of electron micrographs of 2-nm gold particles, recorded over a
period of 5 min, is shown in Figure 7.20, and illustrates the changing shape and
structure of the particle. It should be noted that the relatively “poor” quality of these
images is due to the extremely short intervals (1/60 s) between frames; nonetheless,
the quality of these images is excellent and cannot be overestimated.
The particle shown in Figure 7.20 changes its shape from single twins (a, d, and i) to
multiply twinned icosahedral particles (b and h) and to cuboctahedral particles (e, f,
and i). In all cases, the lattice visible fringes correspond to the (111) lattice plane. The
temperature of the gold particle was not significantly higher than 370 K and the series
Figure 7.20 Series of electron micrographs of
2-nm gold particles [19], taken at intervals of
1/60 s. The images show spontaneous changes
in particle habitus (fluctuations) at a
temperature of approximately 370 K, from
single twins (a, d, and i) to multiple twinned
icosahedral particles (b and h) and further to
cuboctahedral shapes (e, f, and i).
(Reproduction with permission by Sumio Iijima
and the American Physical Society.)
7.6 A Closer Look at Nanoparticle Melting j155