

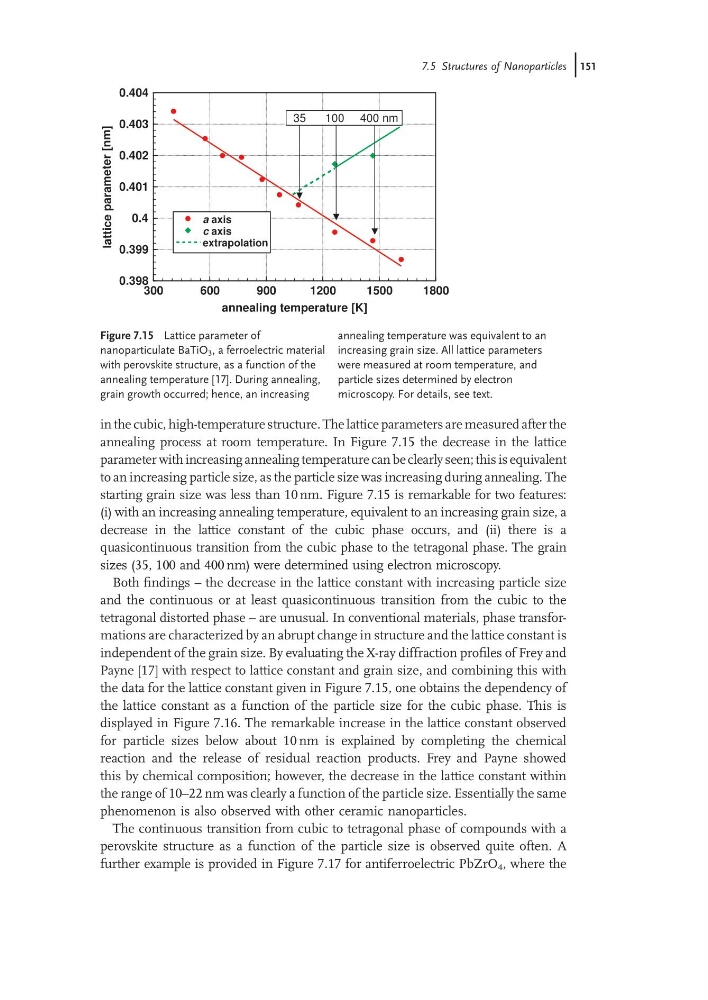
in the cubic, high-temperature structure. The lattice parameters are measured after the
annealing process at room temperature. In Figure 7.15 the decrease in the lattice
parameter with increasing annealing temperature can be clearly seen; this is equivalent
to an increasing particle size, as the particle size was increasing during annealing. The
starting grain size was less than 10 nm. Figure 7.15 is remarkable for two features:
(i) with an increasing annealing temperature, equivalent to an increasing grain size, a
decrease in the lattice constant of the cubic phase occurs, and (ii) there is a
quasicontinuous transition from the cubic phase to the tetragonal phase. The grain
sizes (35, 100 and 400 nm) were determined using electron microscopy.
Both findings – the decrease in the lattice constant with increasing particle size
and the continuous or at least quasicontinuous transition from the cubic to the
tetragonal distorted phase – are unusual. In conventional materials, phase transformations are characterized by an abrupt change in structure and the lattice constant is
independent of the grain size. By evaluating the X-ray diffraction profiles of Frey and
Payne [17] with respect to lattice constant and grain size, and combining this with
the data for the lattice constant given in Figure 7.15, one obtains the dependency of
the lattice constant as a function of the particle size for the cubic phase. This is
displayed in Figure 7.16. The remarkable increase in the lattice constant observed
for particle sizes below about 10 nm is explained by completing the chemical
reaction and the release of residual reaction products. Frey and Payne showed
this by chemical composition; however, the decrease in the lattice constant within
the range of 10–22 nm was clearly a function of the particle size. Essentially the same
phenomenon is also observed with other ceramic nanoparticles.
The continuous transition from cubic to tetragonal phase of compounds with a
perovskite structure as a function of the particle size is observed quite often. A
further example is provided in Figure 7.17 for antiferroelectric PbZrO 4 , where the
300
600
900
1200
1500
1800
annealing temperature [K]
0.398
0.399
0.4
0.401
0.402
0.403
0.404
lattice
parameter
[nm]
a axis
c axis
extrapolation
400 nm
35
100
Figure 7.15 Lattice parameter of
nanoparticulate BaTiO 3 , a ferroelectric material
with perovskite structure, as a function of the
annealing temperature [17]. During annealing,
grain growth occurred; hence, an increasing
annealing temperature was equivalent to an
increasing grain size. All lattice parameters
were measured at room temperature, and
particle sizes determined by electron
microscopy. For details, see text.
7.5 Structures of Nanoparticles j151
annealing process at room temperature. In Figure 7.15 the decrease in the lattice
parameter with increasing annealing temperature can be clearly seen; this is equivalent
to an increasing particle size, as the particle size was increasing during annealing. The
starting grain size was less than 10 nm. Figure 7.15 is remarkable for two features:
(i) with an increasing annealing temperature, equivalent to an increasing grain size, a
decrease in the lattice constant of the cubic phase occurs, and (ii) there is a
quasicontinuous transition from the cubic phase to the tetragonal phase. The grain
sizes (35, 100 and 400 nm) were determined using electron microscopy.
Both findings – the decrease in the lattice constant with increasing particle size
and the continuous or at least quasicontinuous transition from the cubic to the
tetragonal distorted phase – are unusual. In conventional materials, phase transformations are characterized by an abrupt change in structure and the lattice constant is
independent of the grain size. By evaluating the X-ray diffraction profiles of Frey and
Payne [17] with respect to lattice constant and grain size, and combining this with
the data for the lattice constant given in Figure 7.15, one obtains the dependency of
the lattice constant as a function of the particle size for the cubic phase. This is
displayed in Figure 7.16. The remarkable increase in the lattice constant observed
for particle sizes below about 10 nm is explained by completing the chemical
reaction and the release of residual reaction products. Frey and Payne showed
this by chemical composition; however, the decrease in the lattice constant within
the range of 10–22 nm was clearly a function of the particle size. Essentially the same
phenomenon is also observed with other ceramic nanoparticles.
The continuous transition from cubic to tetragonal phase of compounds with a
perovskite structure as a function of the particle size is observed quite often. A
further example is provided in Figure 7.17 for antiferroelectric PbZrO 4 , where the
300
600
900
1200
1500
1800
annealing temperature [K]
0.398
0.399
0.4
0.401
0.402
0.403
0.404
lattice
parameter
[nm]
a axis
c axis
extrapolation
400 nm
35
100
Figure 7.15 Lattice parameter of
nanoparticulate BaTiO 3 , a ferroelectric material
with perovskite structure, as a function of the
annealing temperature [17]. During annealing,
grain growth occurred; hence, an increasing
annealing temperature was equivalent to an
increasing grain size. All lattice parameters
were measured at room temperature, and
particle sizes determined by electron
microscopy. For details, see text.
7.5 Structures of Nanoparticles j151