

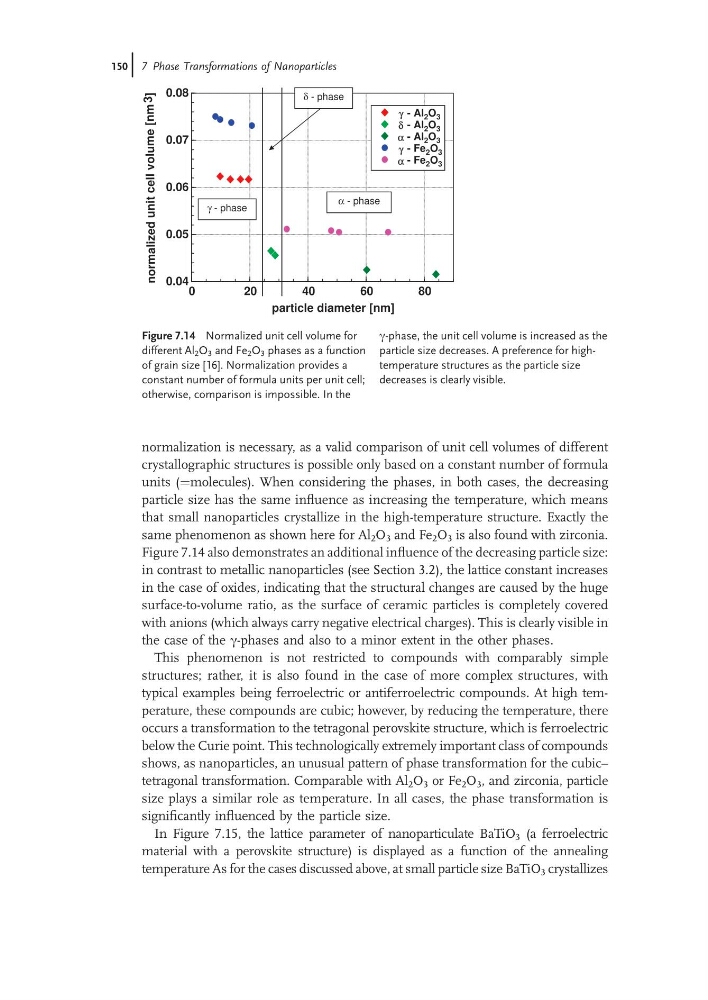
normalization is necessary, as a valid comparison of unit cell volumes of different
crystallographic structures is possible only based on a constant number of formula
units (¼molecules). When considering the phases, in both cases, the decreasing
particle size has the same influence as increasing the temperature, which means
that small nanoparticles crystallize in the high-temperature structure. Exactly the
same phenomenon as shown here for Al 2 O 3 and Fe 2 O 3 is also found with zirconia.
Figure 7.14 also demonstrates an additional influence of the decreasing particle size:
in contrast to metallic nanoparticles (see Section 3.2), the lattice constant increases
in the case of oxides, indicating that the structural changes are caused by the huge
surface-to-volume ratio, as the surface of ceramic particles is completely covered
with anions (which always carry negative electrical charges). This is clearly visible in
the case of the c-phases and also to a minor extent in the other phases.
This phenomenon is not restricted to compounds with comparably simple
structures; rather, it is also found in the case of more complex structures, with
typical examples being ferroelectric or antiferroelectric compounds. At high temperature, these compounds are cubic; however, by reducing the temperature, there
occurs a transformation to the tetragonal perovskite structure, which is ferroelectric
below the Curie point. This technologically extremely important class of compounds
shows, as nanoparticles, an unusual pattern of phase transformation for the cubic–
tetragonal transformation. Comparable with Al 2 O 3 or Fe 2 O 3 , and zirconia, particle
size plays a similar role as temperature. In all cases, the phase transformation is
significantly influenced by the particle size.
In Figure 7.15, the lattice parameter of nanoparticulate BaTiO 3 (a ferroelectric
material with a perovskite structure) is displayed as a function of the annealing
temperature As for the cases discussed above, at small particle size BaTiO 3 crystallizes
0
20
40
60
80
0.04
0.05
0.06
0.07
0.08
normalized
unit
cell
volume
[nm
3 ]
a - Al 2 O 3
a - Al 2 O 3
a - Al 2 O 3
a - Fe 2 O 3
a - Fe 2 O 3
γ
δ
α
γ
α
γ phase
-
α phase
-
δ phase
-
particle diameter [nm]
Figure 7.14 Normalized unit cell volume for
different Al 2 O 3 and Fe 2 O 3 phases as a function
of grain size [16]. Normalization provides a
constant number of formula units per unit cell;
otherwise, comparison is impossible. In the
c-phase, the unit cell volume is increased as the
particle size decreases. A preference for hightemperature structures as the particle size
decreases is clearly visible.
150j 7 Phase Transformations of Nanoparticles
crystallographic structures is possible only based on a constant number of formula
units (¼molecules). When considering the phases, in both cases, the decreasing
particle size has the same influence as increasing the temperature, which means
that small nanoparticles crystallize in the high-temperature structure. Exactly the
same phenomenon as shown here for Al 2 O 3 and Fe 2 O 3 is also found with zirconia.
Figure 7.14 also demonstrates an additional influence of the decreasing particle size:
in contrast to metallic nanoparticles (see Section 3.2), the lattice constant increases
in the case of oxides, indicating that the structural changes are caused by the huge
surface-to-volume ratio, as the surface of ceramic particles is completely covered
with anions (which always carry negative electrical charges). This is clearly visible in
the case of the c-phases and also to a minor extent in the other phases.
This phenomenon is not restricted to compounds with comparably simple
structures; rather, it is also found in the case of more complex structures, with
typical examples being ferroelectric or antiferroelectric compounds. At high temperature, these compounds are cubic; however, by reducing the temperature, there
occurs a transformation to the tetragonal perovskite structure, which is ferroelectric
below the Curie point. This technologically extremely important class of compounds
shows, as nanoparticles, an unusual pattern of phase transformation for the cubic–
tetragonal transformation. Comparable with Al 2 O 3 or Fe 2 O 3 , and zirconia, particle
size plays a similar role as temperature. In all cases, the phase transformation is
significantly influenced by the particle size.
In Figure 7.15, the lattice parameter of nanoparticulate BaTiO 3 (a ferroelectric
material with a perovskite structure) is displayed as a function of the annealing
temperature As for the cases discussed above, at small particle size BaTiO 3 crystallizes
0
20
40
60
80
0.04
0.05
0.06
0.07
0.08
normalized
unit
cell
volume
[nm
3 ]
a - Al 2 O 3
a - Al 2 O 3
a - Al 2 O 3
a - Fe 2 O 3
a - Fe 2 O 3
γ
δ
α
γ
α
γ phase
-
α phase
-
δ phase
-
particle diameter [nm]
Figure 7.14 Normalized unit cell volume for
different Al 2 O 3 and Fe 2 O 3 phases as a function
of grain size [16]. Normalization provides a
constant number of formula units per unit cell;
otherwise, comparison is impossible. In the
c-phase, the unit cell volume is increased as the
particle size decreases. A preference for hightemperature structures as the particle size
decreases is clearly visible.
150j 7 Phase Transformations of Nanoparticles