

7.5
Structures of Nanoparticles
The phenomena described above for zirconia are not restricted to compounds with
comparatively “simple” structures. In the case of zirconia, the temperature of phase
transformation was found to decrease with decreasing particle size, which led to the
fact that the tetragonal phase – a high-temperature phase – is found at room
temperature. Additionally, in the case of particles with sizes less than 5 nm the cubic
phase is quite often found. Ayyub et al. [16] drafted a rule that stated that with
decreasing particle size, nanoparticles prefer the phase with a higher symmetry. As,
in general, the latter phase is the high-temperature phase (the phase with the highest
entropy), this led to the proposition that nanoparticles would tend to crystallize in the
high-temperature phase, provided that they were small enough. (Here it is necessary
to explain the term symmetry as it is used in connection with entropy. In contrast to
the concept of symmetry in geometry or crystallography, where well-defined,
discrete points must be aligned, in statistical thermodynamics the symmetry of a
system is higher; more permutations are possible, independently of the actual
feasibility. Having this in mind it is obvious that a gas has the highest possible
symmetry and, hence, the highest entropy.) This concept is outlined in the following
section, using a few ceramic materials as examples.
Ayyub et al. [16] reported the details of lattice constant determinations for Al 2 O 3
and Fe 2 O 3 . These two oxides have common characteristics, with conventional grain
size at room temperature; both crystallize in the hexagonal a-phase and in both
cases the cubic c-phase is observed at high temperatures. Although alumina has a
few more intermediate phases, these are not discussed in this context.
The sequence of phases is shown diagrammatically in Figure 7.14, where the
normalized unit cell volumes are plotted as a function of the particle size. This
0
10
20
30
40
50
particle diameter [nm]
100
300
500
700
900
temperature
[K]
temperature after coagulation
melting point of the coagulated particle
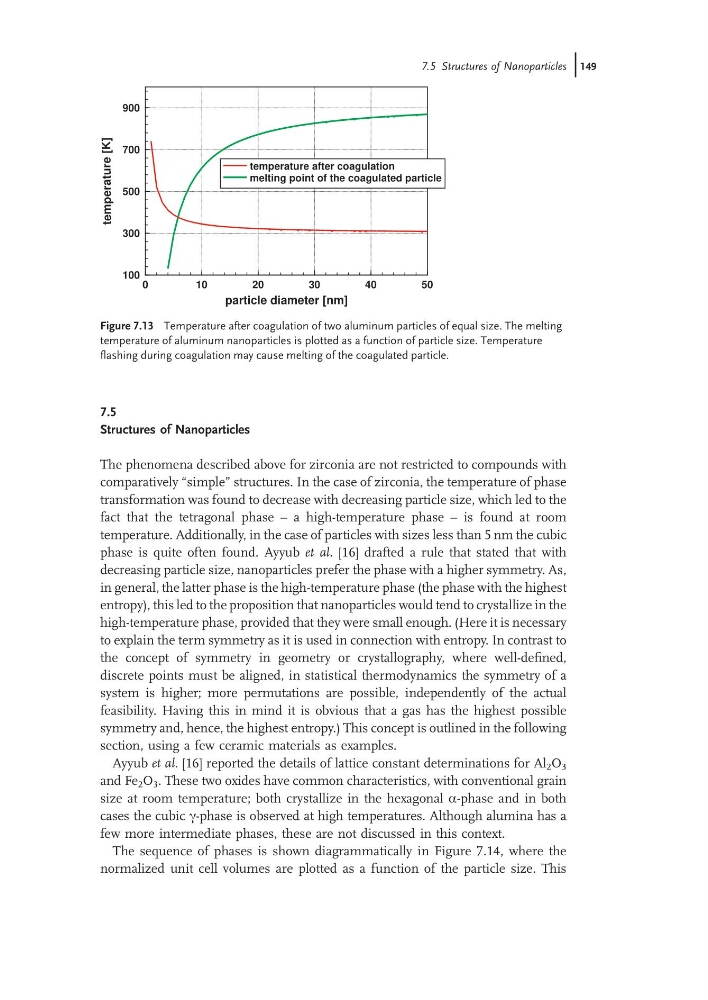
Figure 7.13 Temperature after coagulation of two aluminum particles of equal size. The melting
temperature of aluminum nanoparticles is plotted as a function of particle size. Temperature
flashing during coagulation may cause melting of the coagulated particle.
7.5 Structures of Nanoparticles j149
Structures of Nanoparticles
The phenomena described above for zirconia are not restricted to compounds with
comparatively “simple” structures. In the case of zirconia, the temperature of phase
transformation was found to decrease with decreasing particle size, which led to the
fact that the tetragonal phase – a high-temperature phase – is found at room
temperature. Additionally, in the case of particles with sizes less than 5 nm the cubic
phase is quite often found. Ayyub et al. [16] drafted a rule that stated that with
decreasing particle size, nanoparticles prefer the phase with a higher symmetry. As,
in general, the latter phase is the high-temperature phase (the phase with the highest
entropy), this led to the proposition that nanoparticles would tend to crystallize in the
high-temperature phase, provided that they were small enough. (Here it is necessary
to explain the term symmetry as it is used in connection with entropy. In contrast to
the concept of symmetry in geometry or crystallography, where well-defined,
discrete points must be aligned, in statistical thermodynamics the symmetry of a
system is higher; more permutations are possible, independently of the actual
feasibility. Having this in mind it is obvious that a gas has the highest possible
symmetry and, hence, the highest entropy.) This concept is outlined in the following
section, using a few ceramic materials as examples.
Ayyub et al. [16] reported the details of lattice constant determinations for Al 2 O 3
and Fe 2 O 3 . These two oxides have common characteristics, with conventional grain
size at room temperature; both crystallize in the hexagonal a-phase and in both
cases the cubic c-phase is observed at high temperatures. Although alumina has a
few more intermediate phases, these are not discussed in this context.
The sequence of phases is shown diagrammatically in Figure 7.14, where the
normalized unit cell volumes are plotted as a function of the particle size. This
0
10
20
30
40
50
particle diameter [nm]
100
300
500
700
900
temperature
[K]
temperature after coagulation
melting point of the coagulated particle
Figure 7.13 Temperature after coagulation of two aluminum particles of equal size. The melting
temperature of aluminum nanoparticles is plotted as a function of particle size. Temperature
flashing during coagulation may cause melting of the coagulated particle.
7.5 Structures of Nanoparticles j149