

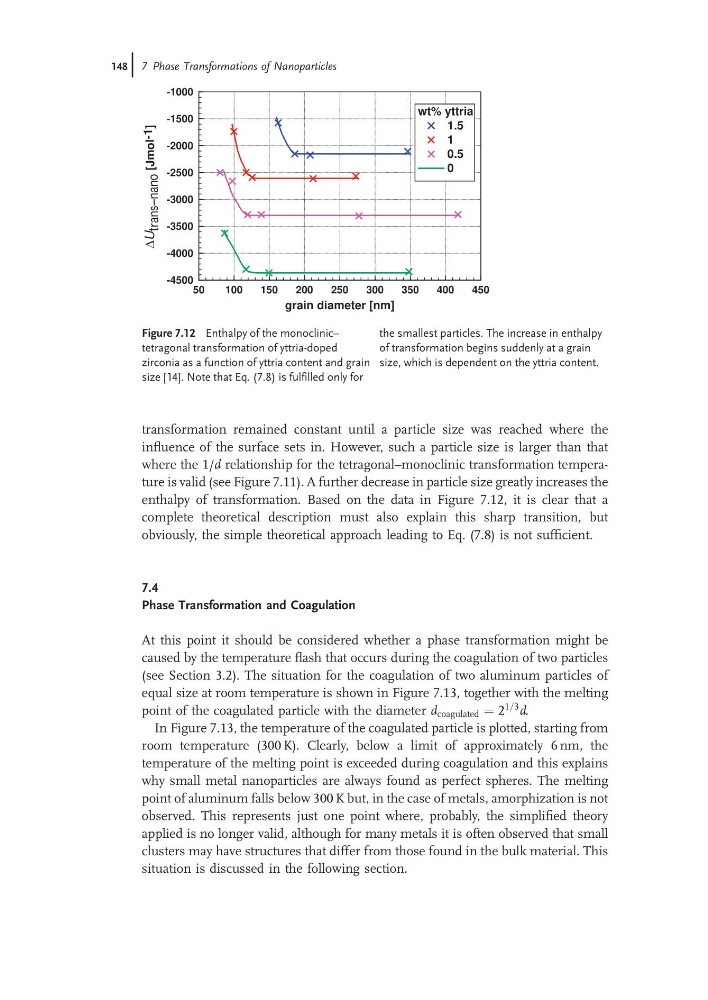
transformation remained constant until a particle size was reached where the
influence of the surface sets in. However, such a particle size is larger than that
where the 1/d relationship for the tetragonal–monoclinic transformation temperature is valid (see Figure 7.11). A further decrease in particle size greatly increases the
enthalpy of transformation. Based on the data in Figure 7.12, it is clear that a
complete theoretical description must also explain this sharp transition, but
obviously, the simple theoretical approach leading to Eq. (7.8) is not sufficient.
7.4
Phase Transformation and Coagulation
At this point it should be considered whether a phase transformation might be
caused by the temperature flash that occurs during the coagulation of two particles
(see Section 3.2). The situation for the coagulation of two aluminum particles of
equal size at room temperature is shown in Figure 7.13, together with the melting
point of the coagulated particle with the diameter d coagulated ¼ 2
1=3
d.
In Figure 7.13, the temperature of the coagulated particle is plotted, starting from
room temperature (300 K). Clearly, below a limit of approximately 6 nm, the
temperature of the melting point is exceeded during coagulation and this explains
why small metal nanoparticles are always found as perfect spheres. The melting
point of aluminum falls below 300 K but, in the case of metals, amorphization is not
observed. This represents just one point where, probably, the simplified theory
applied is no longer valid, although for many metals it is often observed that small
clusters may have structures that differ from those found in the bulk material. This
situation is discussed in the following section.
50
100
150
200
250
300
350
400
450
grain diameter [nm]
-4500
-4000
-3500
-3000
-2500
-2000
-1500
-1000
U trans–nano [Jmol
-1 ]
wt% yttria
1.5
1
0.5
0
Δ
Figure 7.12 Enthalpy of the monoclinic–
tetragonal transformation of yttria-doped
zirconia as a function of yttria content and grain
size [14]. Note that Eq. (7.8) is fulfilled only for
the smallest particles. The increase in enthalpy
of transformation begins suddenly at a grain
size, which is dependent on the yttria content.
148j 7 Phase Transformations of Nanoparticles
influence of the surface sets in. However, such a particle size is larger than that
where the 1/d relationship for the tetragonal–monoclinic transformation temperature is valid (see Figure 7.11). A further decrease in particle size greatly increases the
enthalpy of transformation. Based on the data in Figure 7.12, it is clear that a
complete theoretical description must also explain this sharp transition, but
obviously, the simple theoretical approach leading to Eq. (7.8) is not sufficient.
7.4
Phase Transformation and Coagulation
At this point it should be considered whether a phase transformation might be
caused by the temperature flash that occurs during the coagulation of two particles
(see Section 3.2). The situation for the coagulation of two aluminum particles of
equal size at room temperature is shown in Figure 7.13, together with the melting
point of the coagulated particle with the diameter d coagulated ¼ 2
1=3
d.
In Figure 7.13, the temperature of the coagulated particle is plotted, starting from
room temperature (300 K). Clearly, below a limit of approximately 6 nm, the
temperature of the melting point is exceeded during coagulation and this explains
why small metal nanoparticles are always found as perfect spheres. The melting
point of aluminum falls below 300 K but, in the case of metals, amorphization is not
observed. This represents just one point where, probably, the simplified theory
applied is no longer valid, although for many metals it is often observed that small
clusters may have structures that differ from those found in the bulk material. This
situation is discussed in the following section.
50
100
150
200
250
300
350
400
450
grain diameter [nm]
-4500
-4000
-3500
-3000
-2500
-2000
-1500
-1000
U trans–nano [Jmol
-1 ]
wt% yttria
1.5
1
0.5
0
Δ
Figure 7.12 Enthalpy of the monoclinic–
tetragonal transformation of yttria-doped
zirconia as a function of yttria content and grain
size [14]. Note that Eq. (7.8) is fulfilled only for
the smallest particles. The increase in enthalpy
of transformation begins suddenly at a grain
size, which is dependent on the yttria content.
148j 7 Phase Transformations of Nanoparticles