

and copper dispersed as the nanoparticles. The heat capacity ratio is defined as the heat
capacity of the suspension compared to that of the base fluid without any additions.
Consequently, the pure base liquid has a heat capacity ratio of 1. The data in Figure 6.2
show a slight improvement in the heat capacity ratio, such that the increase in heat
capacity is greater than the volume content.
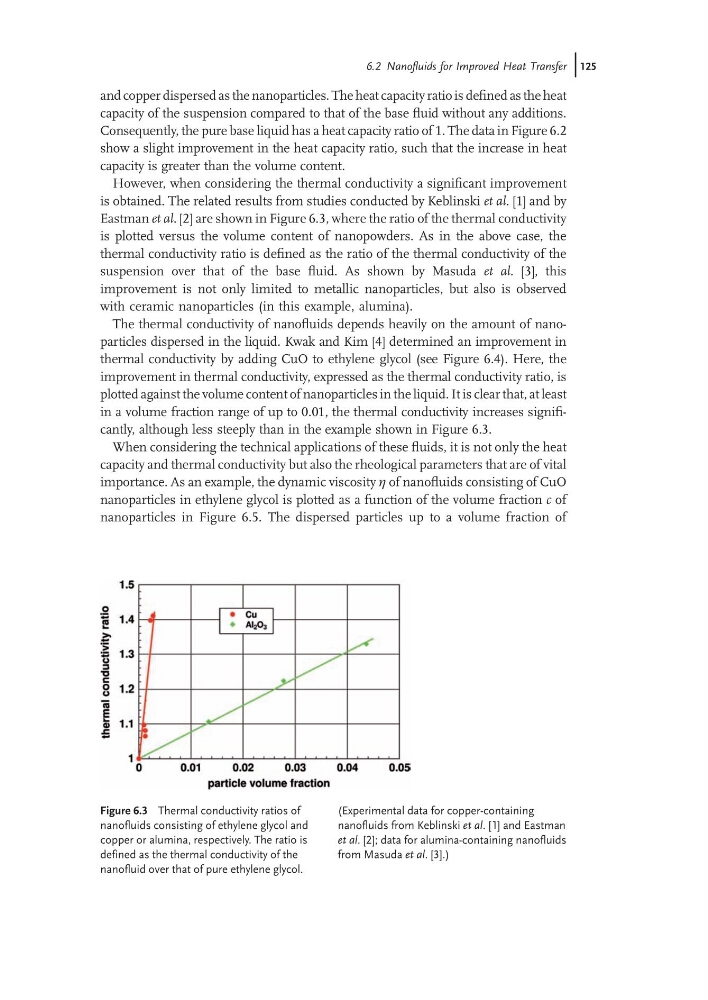
However, when considering the thermal conductivity a significant improvement
is obtained. The related results from studies conducted by Keblinski et al. [1] and by
Eastman et al. [2] are shown in Figure 6.3, where the ratio of the thermal conductivity
is plotted versus the volume content of nanopowders. As in the above case, the
thermal conductivity ratio is defined as the ratio of the thermal conductivity of the
suspension over that of the base fluid. As shown by Masuda et al. [3], this
improvement is not only limited to metallic nanoparticles, but also is observed
with ceramic nanoparticles (in this example, alumina).
The thermal conductivity of nanofluids depends heavily on the amount of nanoparticles dispersed in the liquid. Kwak and Kim [4] determined an improvement in
thermal conductivity by adding CuO to ethylene glycol (see Figure 6.4). Here, the
improvement in thermal conductivity, expressed as the thermal conductivity ratio, is
plotted against the volume content of nanoparticles in the liquid. It is clear that, at least
in a volume fraction range of up to 0.01, the thermal conductivity increases significantly, although less steeply than in the example shown in Figure 6.3.
When considering the technical applications of these fluids, it is not only the heat
capacity and thermal conductivity but also the rheological parameters that are of vital
importance. As an example, the dynamic viscosity g of nanofluids consisting of CuO
nanoparticles in ethylene glycol is plotted as a function of the volume fraction c of
nanoparticles in Figure 6.5. The dispersed particles up to a volume fraction of
Figure 6.3 Thermal conductivity ratios of
nanofluids consisting of ethylene glycol and
copper or alumina, respectively. The ratio is
defined as the thermal conductivity of the
nanofluid over that of pure ethylene glycol.
(Experimental data for copper-containing
nanofluids from Keblinski et al. [1] and Eastman
et al. [2]; data for alumina-containing nanofluids
from Masuda et al. [3].)
6.2 Nanofluids for Improved Heat Transfer j125
capacity of the suspension compared to that of the base fluid without any additions.
Consequently, the pure base liquid has a heat capacity ratio of 1. The data in Figure 6.2
show a slight improvement in the heat capacity ratio, such that the increase in heat
capacity is greater than the volume content.
However, when considering the thermal conductivity a significant improvement
is obtained. The related results from studies conducted by Keblinski et al. [1] and by
Eastman et al. [2] are shown in Figure 6.3, where the ratio of the thermal conductivity
is plotted versus the volume content of nanopowders. As in the above case, the
thermal conductivity ratio is defined as the ratio of the thermal conductivity of the
suspension over that of the base fluid. As shown by Masuda et al. [3], this
improvement is not only limited to metallic nanoparticles, but also is observed
with ceramic nanoparticles (in this example, alumina).
The thermal conductivity of nanofluids depends heavily on the amount of nanoparticles dispersed in the liquid. Kwak and Kim [4] determined an improvement in
thermal conductivity by adding CuO to ethylene glycol (see Figure 6.4). Here, the
improvement in thermal conductivity, expressed as the thermal conductivity ratio, is
plotted against the volume content of nanoparticles in the liquid. It is clear that, at least
in a volume fraction range of up to 0.01, the thermal conductivity increases significantly, although less steeply than in the example shown in Figure 6.3.
When considering the technical applications of these fluids, it is not only the heat
capacity and thermal conductivity but also the rheological parameters that are of vital
importance. As an example, the dynamic viscosity g of nanofluids consisting of CuO
nanoparticles in ethylene glycol is plotted as a function of the volume fraction c of
nanoparticles in Figure 6.5. The dispersed particles up to a volume fraction of
Figure 6.3 Thermal conductivity ratios of
nanofluids consisting of ethylene glycol and
copper or alumina, respectively. The ratio is
defined as the thermal conductivity of the
nanofluid over that of pure ethylene glycol.
(Experimental data for copper-containing
nanofluids from Keblinski et al. [1] and Eastman
et al. [2]; data for alumina-containing nanofluids
from Masuda et al. [3].)
6.2 Nanofluids for Improved Heat Transfer j125