

① If p 21 > p 11 , that is comparing to classifier 1, classifier increases the accuracy for
falling data. Then, the corresponding accuracy for non-falling data will be reduced:
p 22 < p 12 . According to (11)(12), Sens’ # and Spec ".
② If p 21 > p 11 , that is comparing to classifier 1, classifier reduces the accuracy for
falling data. Then, the corresponding accuracy for non-falling data will be increased:
p 22 < p 12 . According to (11)(12), Sens’ " and Spec #.
2.4 Data Threshold Training Based on XGBoost
According to the data analysis results, and combined with the actual situation, we use
3 s data (setting T = 100 Hz, then Win = 300, the corresponding window data size is
300 groups) as a critical window to determine whether a person has fallen; that is, the
feature value of the fall occurred within the last 3 s. Before training for XGBoost, we
first need to manually mark our falling data. In order to make the training results more
accurate, we make preset values for the threshold.
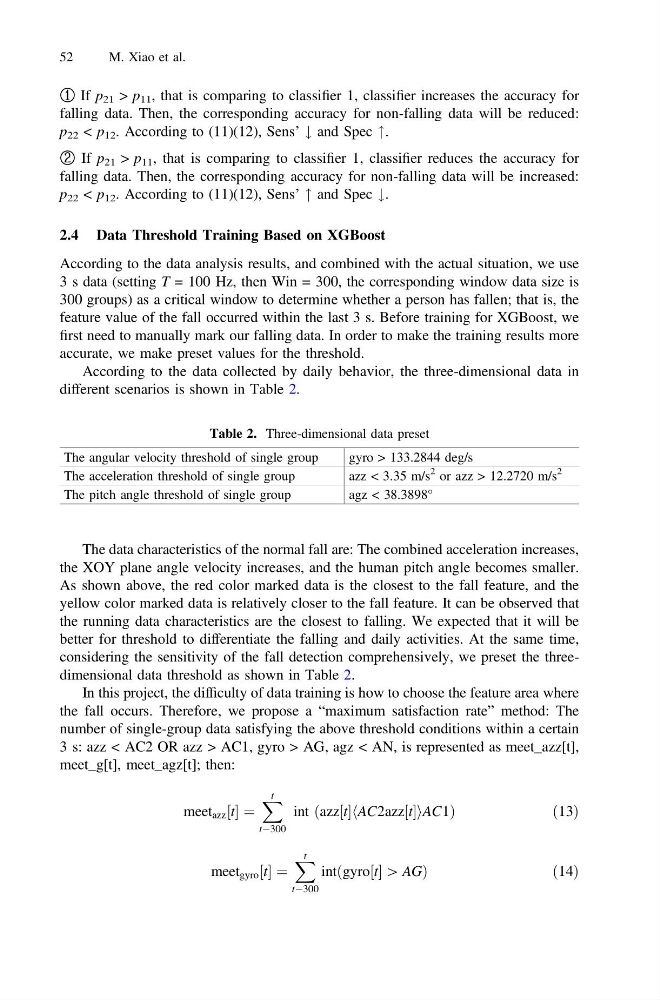
According to the data collected by daily behavior, the three-dimensional data in
different scenarios is shown in Table 2.
The data characteristics of the normal fall are: The combined acceleration increases,
the XOY plane angle velocity increases, and the human pitch angle becomes smaller.
As shown above, the red color marked data is the closest to the fall feature, and the
yellow color marked data is relatively closer to the fall feature. It can be observed that
the running data characteristics are the closest to falling. We expected that it will be
better for threshold to differentiate the falling and daily activities. At the same time,
considering the sensitivity of the fall detection comprehensively, we preset the threedimensional data threshold as shown in Table 2.
In this project, the difficulty of data training is how to choose the feature area where
the fall occurs. Therefore, we propose a “maximum satisfaction rate” method: The
number of single-group data satisfying the above threshold conditions within a certain
3 s: azz < AC2 OR azz > AC1, gyro > AG, agz < AN, is represented as meet_azz[t],
meet_g[t], meet_agz[t]; then:
meet azz t
½ ¼
X t
tÀ300
int azz t
½ AC2azz t
½
h
i AC1
ð
Þ
ð 13Þ
meet gyro t
½ ¼
X t
tÀ300
int gyro t
½ [ AG
ð
Þ
ð 14Þ
Table 2. Three-dimensional data preset
The angular velocity threshold of single group
gyro > 133.2844 deg/s
The acceleration threshold of single group
azz < 3.35 m/s
2 or azz > 12.2720 m/s
2
The pitch angle threshold of single group
agz < 38.3898°
52
M. Xiao et al.
falling data. Then, the corresponding accuracy for non-falling data will be reduced:
p 22 < p 12 . According to (11)(12), Sens’ # and Spec ".
② If p 21 > p 11 , that is comparing to classifier 1, classifier reduces the accuracy for
falling data. Then, the corresponding accuracy for non-falling data will be increased:
p 22 < p 12 . According to (11)(12), Sens’ " and Spec #.
2.4 Data Threshold Training Based on XGBoost
According to the data analysis results, and combined with the actual situation, we use
3 s data (setting T = 100 Hz, then Win = 300, the corresponding window data size is
300 groups) as a critical window to determine whether a person has fallen; that is, the
feature value of the fall occurred within the last 3 s. Before training for XGBoost, we
first need to manually mark our falling data. In order to make the training results more
accurate, we make preset values for the threshold.
According to the data collected by daily behavior, the three-dimensional data in
different scenarios is shown in Table 2.
The data characteristics of the normal fall are: The combined acceleration increases,
the XOY plane angle velocity increases, and the human pitch angle becomes smaller.
As shown above, the red color marked data is the closest to the fall feature, and the
yellow color marked data is relatively closer to the fall feature. It can be observed that
the running data characteristics are the closest to falling. We expected that it will be
better for threshold to differentiate the falling and daily activities. At the same time,
considering the sensitivity of the fall detection comprehensively, we preset the threedimensional data threshold as shown in Table 2.
In this project, the difficulty of data training is how to choose the feature area where
the fall occurs. Therefore, we propose a “maximum satisfaction rate” method: The
number of single-group data satisfying the above threshold conditions within a certain
3 s: azz < AC2 OR azz > AC1, gyro > AG, agz < AN, is represented as meet_azz[t],
meet_g[t], meet_agz[t]; then:
meet azz t
½ ¼
X t
tÀ300
int azz t
½ AC2azz t
½
h
i AC1
ð
Þ
ð 13Þ
meet gyro t
½ ¼
X t
tÀ300
int gyro t
½ [ AG
ð
Þ
ð 14Þ
Table 2. Three-dimensional data preset
The angular velocity threshold of single group
gyro > 133.2844 deg/s
The acceleration threshold of single group
azz < 3.35 m/s
2 or azz > 12.2720 m/s
2
The pitch angle threshold of single group
agz < 38.3898°
52
M. Xiao et al.