

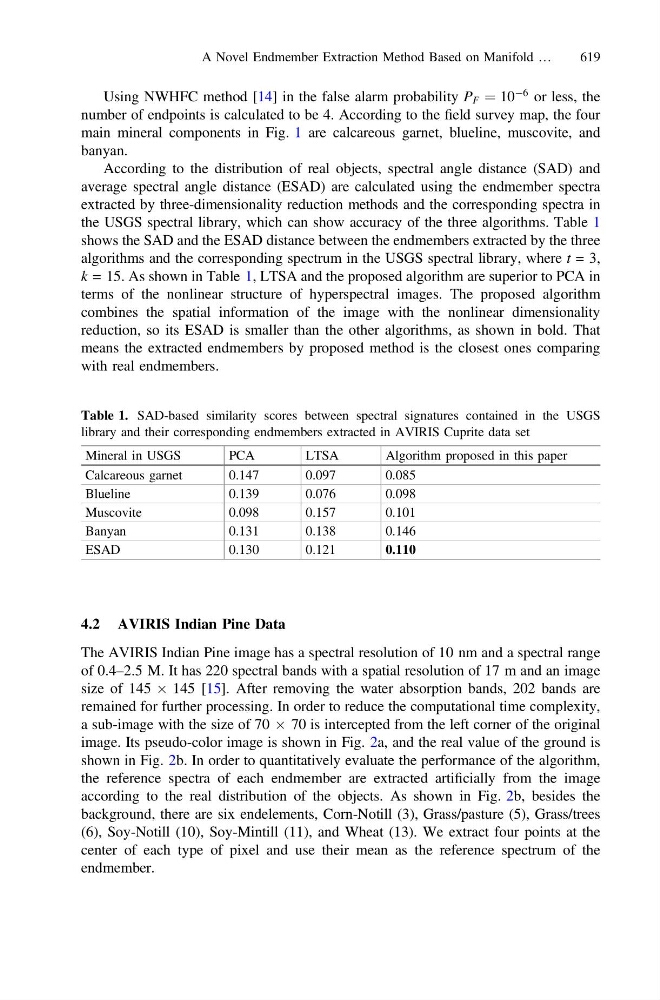
Using NWHFC method [14] in the false alarm probability P F ¼ 10
À6 or less, the
number of endpoints is calculated to be 4. According to the field survey map, the four
main mineral components in Fig. 1 are calcareous garnet, blueline, muscovite, and
banyan.
According to the distribution of real objects, spectral angle distance (SAD) and
average spectral angle distance (ESAD) are calculated using the endmember spectra
extracted by three-dimensionality reduction methods and the corresponding spectra in
the USGS spectral library, which can show accuracy of the three algorithms. Table 1
shows the SAD and the ESAD distance between the endmembers extracted by the three
algorithms and the corresponding spectrum in the USGS spectral library, where t = 3,
k = 15. As shown in Table 1, LTSA and the proposed algorithm are superior to PCA in
terms of the nonlinear structure of hyperspectral images. The proposed algorithm
combines the spatial information of the image with the nonlinear dimensionality
reduction, so its ESAD is smaller than the other algorithms, as shown in bold. That
means the extracted endmembers by proposed method is the closest ones comparing
with real endmembers.
4.2 AVIRIS Indian Pine Data
The AVIRIS Indian Pine image has a spectral resolution of 10 nm and a spectral range
of 0.4–2.5 M. It has 220 spectral bands with a spatial resolution of 17 m and an image
size of 145 Â 145 [15]. After removing the water absorption bands, 202 bands are
remained for further processing. In order to reduce the computational time complexity,
a sub-image with the size of 70 Â 70 is intercepted from the left corner of the original
image. Its pseudo-color image is shown in Fig. 2a, and the real value of the ground is
shown in Fig. 2b. In order to quantitatively evaluate the performance of the algorithm,
the reference spectra of each endmember are extracted artificially from the image
according to the real distribution of the objects. As shown in Fig. 2b, besides the
background, there are six endelements, Corn-Notill (3), Grass/pasture (5), Grass/trees
(6), Soy-Notill (10), Soy-Mintill (11), and Wheat (13). We extract four points at the
center of each type of pixel and use their mean as the reference spectrum of the
endmember.
Table 1. SAD-based similarity scores between spectral signatures contained in the USGS
library and their corresponding endmembers extracted in AVIRIS Cuprite data set
Mineral in USGS
PCA
LTSA
Algorithm proposed in this paper
Calcareous garnet
0.147
0.097
0.085
Blueline
0.139
0.076
0.098
Muscovite
0.098
0.157
0.101
Banyan
0.131
0.138
0.146
ESAD
0.130
0.121
0.110
A Novel Endmember Extraction Method Based on Manifold …
619