

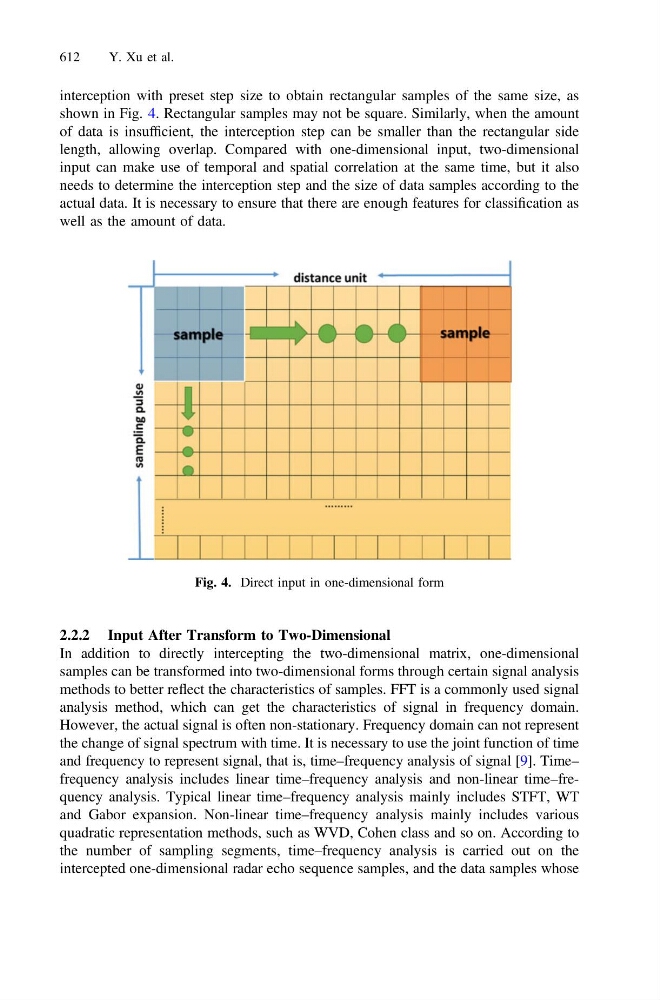
interception with preset step size to obtain rectangular samples of the same size, as
shown in Fig. 4. Rectangular samples may not be square. Similarly, when the amount
of data is insufficient, the interception step can be smaller than the rectangular side
length, allowing overlap. Compared with one-dimensional input, two-dimensional
input can make use of temporal and spatial correlation at the same time, but it also
needs to determine the interception step and the size of data samples according to the
actual data. It is necessary to ensure that there are enough features for classification as
well as the amount of data.
2.2.2 Input After Transform to Two-Dimensional
In addition to directly intercepting the two-dimensional matrix, one-dimensional
samples can be transformed into two-dimensional forms through certain signal analysis
methods to better reflect the characteristics of samples. FFT is a commonly used signal
analysis method, which can get the characteristics of signal in frequency domain.
However, the actual signal is often non-stationary. Frequency domain can not represent
the change of signal spectrum with time. It is necessary to use the joint function of time
and frequency to represent signal, that is, time–frequency analysis of signal [9]. Time–
frequency analysis includes linear time–frequency analysis and non-linear time–frequency analysis. Typical linear time–frequency analysis mainly includes STFT, WT
and Gabor expansion. Non-linear time–frequency analysis mainly includes various
quadratic representation methods, such as WVD, Cohen class and so on. According to
the number of sampling segments, time–frequency analysis is carried out on the
intercepted one-dimensional radar echo sequence samples, and the data samples whose
Fig. 4. Direct input in one-dimensional form
612
Y. Xu et al.