

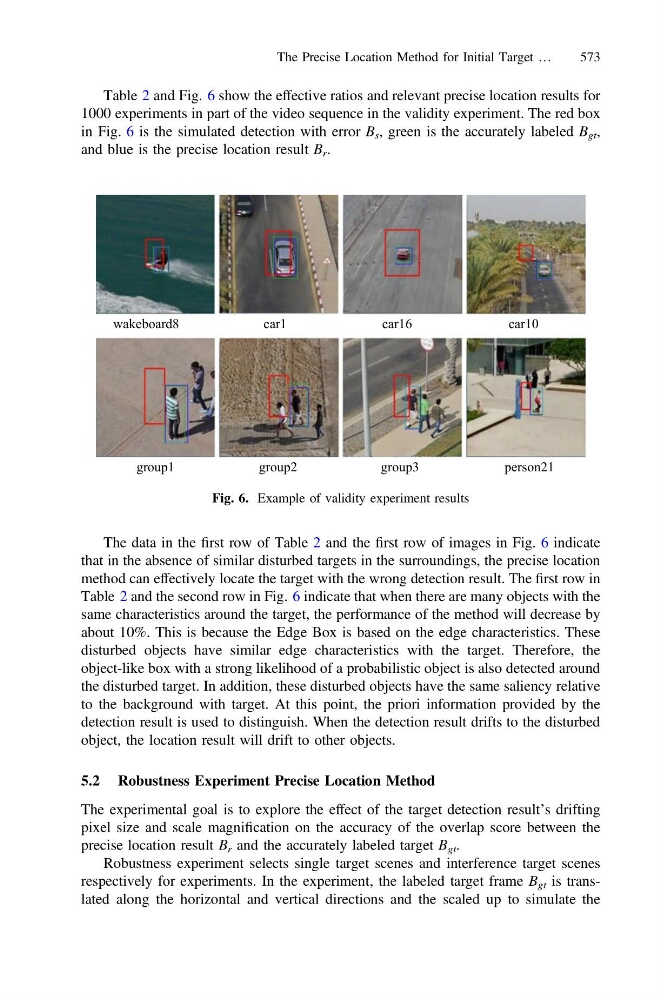
Table 2 and Fig. 6 show the effective ratios and relevant precise location results for
1000 experiments in part of the video sequence in the validity experiment. The red box
in Fig. 6 is the simulated detection with error B s , green is the accurately labeled B gt ,
and blue is the precise location result B r .
The data in the first row of Table 2 and the first row of images in Fig. 6 indicate
that in the absence of similar disturbed targets in the surroundings, the precise location
method can effectively locate the target with the wrong detection result. The first row in
Table 2 and the second row in Fig. 6 indicate that when there are many objects with the
same characteristics around the target, the performance of the method will decrease by
about 10%. This is because the Edge Box is based on the edge characteristics. These
disturbed objects have similar edge characteristics with the target. Therefore, the
object-like box with a strong likelihood of a probabilistic object is also detected around
the disturbed target. In addition, these disturbed objects have the same saliency relative
to the background with target. At this point, the priori information provided by the
detection result is used to distinguish. When the detection result drifts to the disturbed
object, the location result will drift to other objects.
5.2 Robustness Experiment Precise Location Method
The experimental goal is to explore the effect of the target detection result’s drifting
pixel size and scale magnification on the accuracy of the overlap score between the
precise location result B r and the accurately labeled target B gt .
Robustness experiment selects single target scenes and interference target scenes
respectively for experiments. In the experiment, the labeled target frame B gt is translated along the horizontal and vertical directions and the scaled up to simulate the
wakeboard8
car1
car16
car10
group1
group2
group3
person21
Fig. 6. Example of validity experiment results
The Precise Location Method for Initial Target …
573