

5.1 Validity Experiment of Precise Location Method
Validity experiment is mainly to observe whether the method can location the target
accurately when the target detection result is wrong. This paper considers the method
location target effectively when overlap score between B r and B gt exceeds 0.5. In the
experiment, 10 frames of image are selected in each video sequence. B gt of each frame
of image is subjected to 1000 random translation and scale-up to simulate the detection
result with error. The center error range is controlled within [10, 50]. The scale error
ratio is within [1, 3] (Table 2).
Input image I
Target detection position c
Local aera A
Calculate spectral residual
R(f) of image
Calculate saliency score S(x)
of image
Normaliz as sailency
probability p s (x)
Structured edge pixel set E,
edge intensity m e and direction e
Edge points is growed to
edge group ES
A nity between each pair of
neighboring groups is computed
Calculate the object-like value v b
Calculate the object-like probability
p o (x|b,v b )
Calculate Correction
coefficient m
Priori probability p m (x|c)
Multi-information fused
probability p(x|c)
Precise location b r
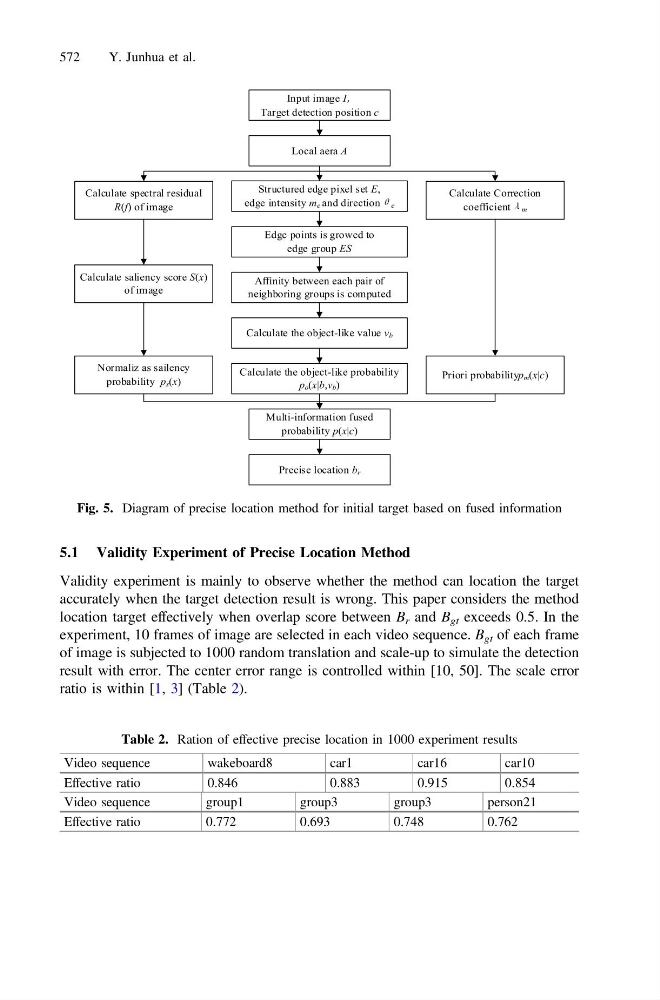
Fig. 5. Diagram of precise location method for initial target based on fused information
Table 2. Ration of effective precise location in 1000 experiment results
Video sequence
wakeboard8
car1
car16
car10
Effective ratio
0.846
0.883
0.915
0.854
Video sequence
group1
group3
group3
person21
Effective ratio
0.772
0.693
0.748
0.762
572
Y. Junhua et al.