

p b i ; c
ð
Þ ¼
1
H b i  W b i
X
x2b i
p xjc
ð Þ:
ð5Þ
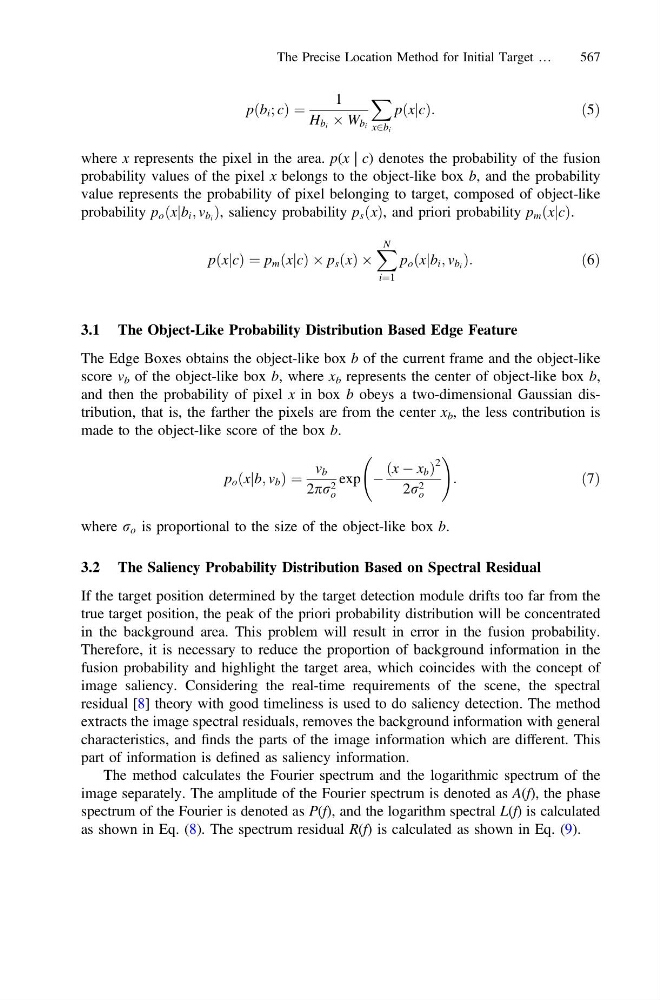
where x represents the pixel in the area. p(x | c) denotes the probability of the fusion
probability values of the pixel x belongs to the object-like box b, and the probability
value represents the probability of pixel belonging to target, composed of object-like
probability p o ðxjb i ; v b i Þ, saliency probability p s x
ð Þ, and priori probability p m xjc
ð Þ.
p xjc
ð Þ ¼ p m xjc
ð Þ Â p s x
ð Þ Â
X N
i¼1
p o xjb i ; v b i
ð
Þ:
ð6Þ
3.1 The Object-Like Probability Distribution Based Edge Feature
The Edge Boxes obtains the object-like box b of the current frame and the object-like
score v b of the object-like box b, where x b represents the center of object-like box b,
and then the probability of pixel x in box b obeys a two-dimensional Gaussian distribution, that is, the farther the pixels are from the center x b , the less contribution is
made to the object-like score of the box b.
p o xjb; v b
ð
Þ¼
v b
2pr 2
o
exp À
x À x b
ð
Þ
2
2r 2
o
!
:
ð7Þ
where r o is proportional to the size of the object-like box b.
3.2 The Saliency Probability Distribution Based on Spectral Residual
If the target position determined by the target detection module drifts too far from the
true target position, the peak of the priori probability distribution will be concentrated
in the background area. This problem will result in error in the fusion probability.
Therefore, it is necessary to reduce the proportion of background information in the
fusion probability and highlight the target area, which coincides with the concept of
image saliency. Considering the real-time requirements of the scene, the spectral
residual [8] theory with good timeliness is used to do saliency detection. The method
extracts the image spectral residuals, removes the background information with general
characteristics, and finds the parts of the image information which are different. This
part of information is defined as saliency information.
The method calculates the Fourier spectrum and the logarithmic spectrum of the
image separately. The amplitude of the Fourier spectrum is denoted as A(f), the phase
spectrum of the Fourier is denoted as P(f), and the logarithm spectral L(f) is calculated
as shown in Eq. (8). The spectrum residual R(f) is calculated as shown in Eq. (9).
The Precise Location Method for Initial Target …
567
ð
Þ ¼
1
H b i  W b i
X
x2b i
p xjc
ð Þ:
ð5Þ
where x represents the pixel in the area. p(x | c) denotes the probability of the fusion
probability values of the pixel x belongs to the object-like box b, and the probability
value represents the probability of pixel belonging to target, composed of object-like
probability p o ðxjb i ; v b i Þ, saliency probability p s x
ð Þ, and priori probability p m xjc
ð Þ.
p xjc
ð Þ ¼ p m xjc
ð Þ Â p s x
ð Þ Â
X N
i¼1
p o xjb i ; v b i
ð
Þ:
ð6Þ
3.1 The Object-Like Probability Distribution Based Edge Feature
The Edge Boxes obtains the object-like box b of the current frame and the object-like
score v b of the object-like box b, where x b represents the center of object-like box b,
and then the probability of pixel x in box b obeys a two-dimensional Gaussian distribution, that is, the farther the pixels are from the center x b , the less contribution is
made to the object-like score of the box b.
p o xjb; v b
ð
Þ¼
v b
2pr 2
o
exp À
x À x b
ð
Þ
2
2r 2
o
!
:
ð7Þ
where r o is proportional to the size of the object-like box b.
3.2 The Saliency Probability Distribution Based on Spectral Residual
If the target position determined by the target detection module drifts too far from the
true target position, the peak of the priori probability distribution will be concentrated
in the background area. This problem will result in error in the fusion probability.
Therefore, it is necessary to reduce the proportion of background information in the
fusion probability and highlight the target area, which coincides with the concept of
image saliency. Considering the real-time requirements of the scene, the spectral
residual [8] theory with good timeliness is used to do saliency detection. The method
extracts the image spectral residuals, removes the background information with general
characteristics, and finds the parts of the image information which are different. This
part of information is defined as saliency information.
The method calculates the Fourier spectrum and the logarithmic spectrum of the
image separately. The amplitude of the Fourier spectrum is denoted as A(f), the phase
spectrum of the Fourier is denoted as P(f), and the logarithm spectral L(f) is calculated
as shown in Eq. (8). The spectrum residual R(f) is calculated as shown in Eq. (9).
The Precise Location Method for Initial Target …
567