

448
S. Chen et al.
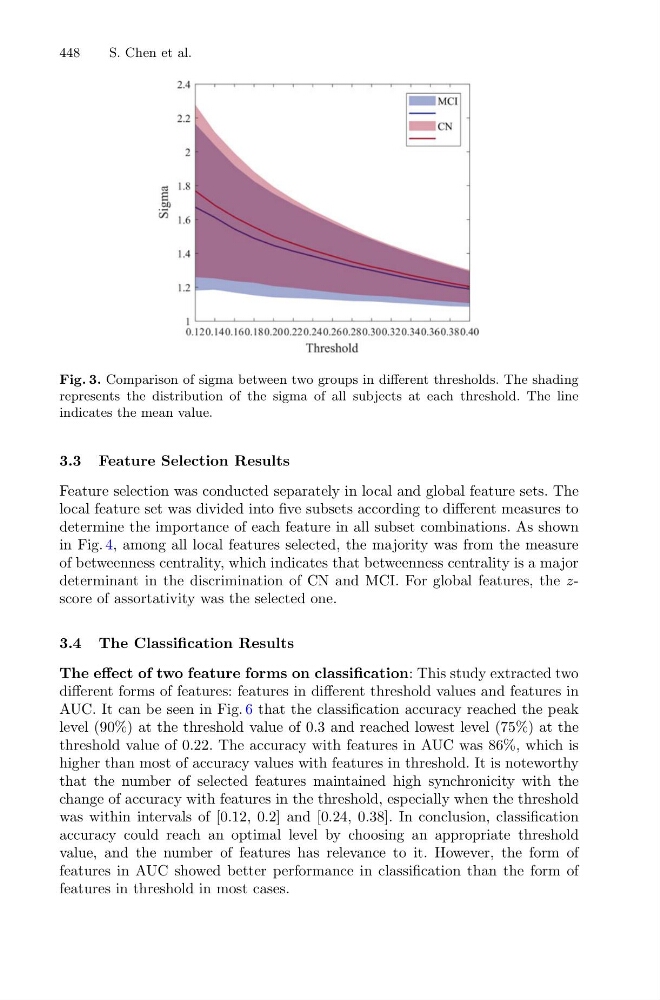
Fig. 3. Comparison of sigma between two groups in different thresholds. The shading
represents the distribution of the sigma of all subjects at each threshold. The line
indicates the mean value.
3.3 Feature Selection Results
Feature selection was conducted separately in local and global feature sets. The
local feature set was divided into five subsets according to different measures to
determine the importance of each feature in all subset combinations. As shown
in Fig. 4, among all local features selected, the majority was from the measure
of betweenness centrality, which indicates that betweenness centrality is a major
determinant in the discrimination of CN and MCI. For global features, the zscore of assortativity was the selected one.
3.4 The Classification Results
The effect of two feature forms on classification: This study extracted two
different forms of features: features in different threshold values and features in
AUC. It can be seen in Fig. 6 that the classification accuracy reached the peak
level (90%) at the threshold value of 0.3 and reached lowest level (75%) at the
threshold value of 0.22. The accuracy with features in AUC was 86%, which is
higher than most of accuracy values with features in threshold. It is noteworthy
that the number of selected features maintained high synchronicity with the
change of accuracy with features in the threshold, especially when the threshold
was within intervals of [0.12, 0.2] and [0.24, 0.38]. In conclusion, classification
accuracy could reach an optimal level by choosing an appropriate threshold
value, and the number of features has relevance to it. However, the form of
features in AUC showed better performance in classification than the form of
features in threshold in most cases.