

Computer-Aided Diagnosis of Mild Cognitive Impairment Based on SVM
449
0
0.2
0.4
0.6
0.8
1
False Positive Rate
0
0.1
0.2
0.3
0.4
0.5
0.6
0.7
0.8
0.9
1
True Positive Rate
ROC
LASSO+Stability Selection(28 features)
LASSO (28 features)
LASSO (36 features)
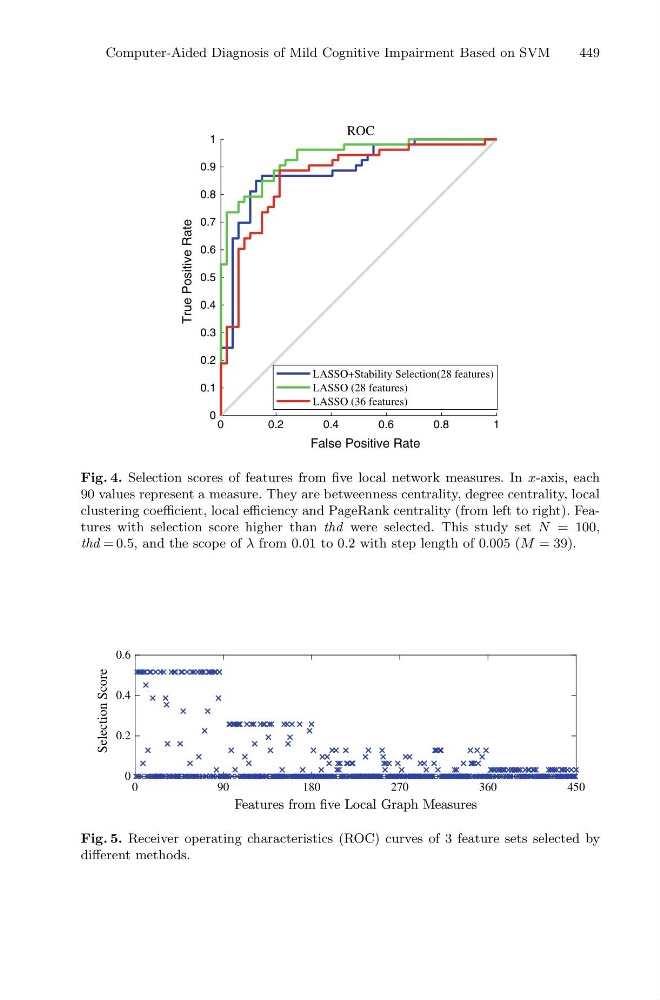
Fig. 4. Selection scores of features from five local network measures. In x-axis, each
90 values represent a measure. They are betweenness centrality, degree centrality, local
clustering coefficient, local efficiency and PageRank centrality (from left to right). Features with selection score higher than thd were selected. This study set N = 100,
thd = 0.5, and the scope of λ from 0.01 to 0.2 with step length of 0.005 (M = 39).
0
90
180
270
360
450
0
0.2
0.4
0.6
Selection Score
Fig. 5. Receiver operating characteristics (ROC) curves of 3 feature sets selected by
different methods.