

Computer-Aided Diagnosis of Mild Cognitive Impairment Based on SVM
447
method was used in this study to construct the classification model with features
in the form of different thresholds and in form of AUC. The toolbox of LIBSVM
provided by Prof. Lin [15] was utilized.
3 Results and Discussion
3.1 Subjects
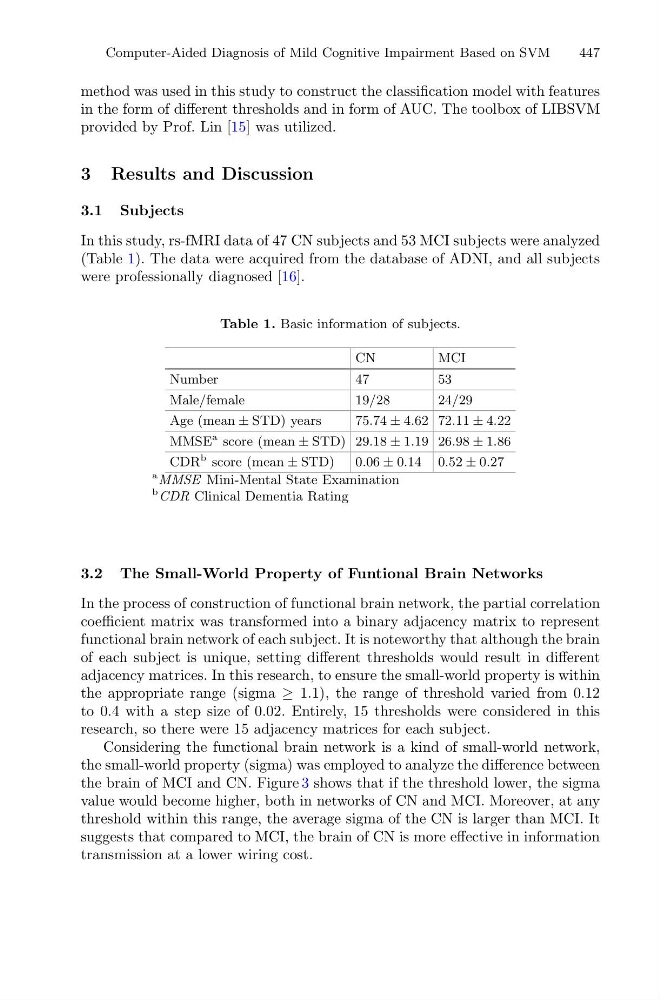
In this study, rs-fMRI data of 47 CN subjects and 53 MCI subjects were analyzed
(Table 1). The data were acquired from the database of ADNI, and all subjects
were professionally diagnosed [16].
Table 1. Basic information of subjects.
CN
MCI
Number
47
53
Male/female
19/28
24/29
Age (mean ± STD) years
75.74 ± 4.62 72.11 ± 4.22
MMSE
a score (mean ± STD) 29.18 ± 1.19 26.98 ± 1.86
CDR
b score (mean ± STD)
0.06 ± 0.14 0.52 ± 0.27
a MMSE Mini-Mental State Examination
b CDR Clinical Dementia Rating
3.2 The Small-World Property of Funtional Brain Networks
In the process of construction of functional brain network, the partial correlation
coefficient matrix was transformed into a binary adjacency matrix to represent
functional brain network of each subject. It is noteworthy that although the brain
of each subject is unique, setting different thresholds would result in different
adjacency matrices. In this research, to ensure the small-world property is within
the appropriate range (sigma ≥ 1.1), the range of threshold varied from 0.12
to 0.4 with a step size of 0.02. Entirely, 15 thresholds were considered in this
research, so there were 15 adjacency matrices for each subject.
Considering the functional brain network is a kind of small-world network,
the small-world property (sigma) was employed to analyze the difference between
the brain of MCI and CN. Figure 3 shows that if the threshold lower, the sigma
value would become higher, both in networks of CN and MCI. Moreover, at any
threshold within this range, the average sigma of the CN is larger than MCI. It
suggests that compared to MCI, the brain of CN is more effective in information
transmission at a lower wiring cost.