

biased to the left side of the heading and the bias flow is negative; and the magnitude of
the drift is related to the vacuum speed and the wind speed and the degree of crosswind.
The angle between the ground speed vector and the wind speed vector, that is, the
wind angle, indicates the extent to which the aircraft is subjected to the crosswind.
Taking the flight path as the reference, when the left-side wind is used, the flight path is
clockwise to the wind direction line, which is positive value, i.e. “+WA”; when the
right-side wind is used, the flight line is counterclockwise to the wind direction line,
which is negative value, i.e. “−WA.”
From the decomposition of the wind, we can know that: V wind  sin(WA) is the
crosswind component, which will make the flight path deviate from the heading line
and generate a bias flow, which will affect the navigation direction; V wind  cos(WA)
is the cis (inverse) wind component, which will affect the ground speed of the aircraft,
make the ground speed not equal to the vacuum speed, and affect the sailing time.
In the track prediction, since the wind directly exerts a force on the aircraft, a bias
flow and a windward wind component are generated, which affects the passing time of
the aircraft. During aircraft flight, according to the known wind direction and wind
speed, the bias flow and ground speed can be calculated, and the distance traveled per
unit time can be obtained:
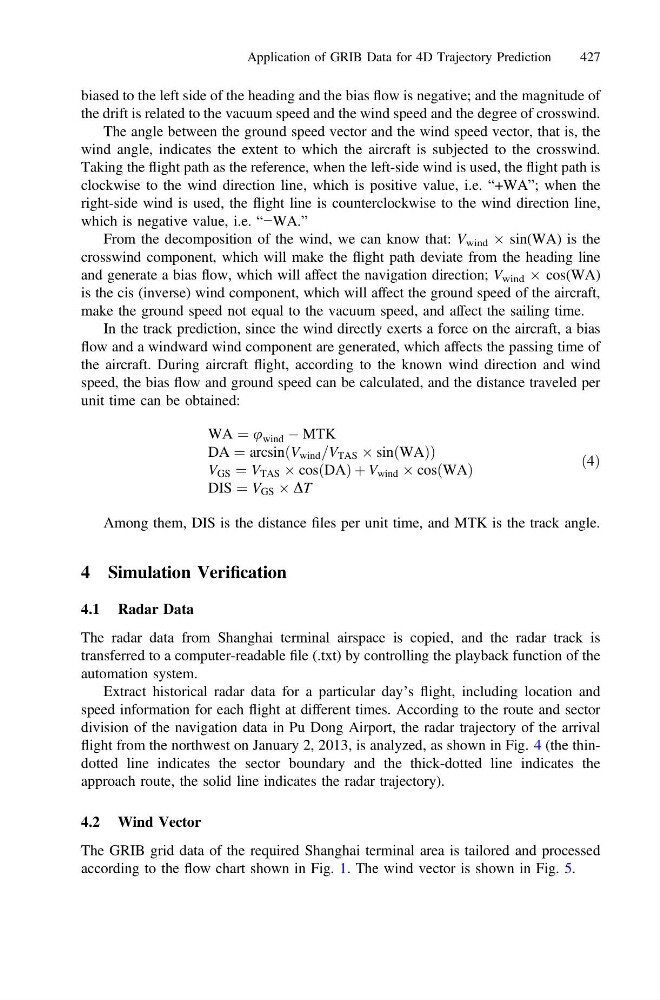
WA ¼ u wind À MTK
DA ¼ arcsinðV wind =V TAS Â sinðWAÞÞ
V GS ¼ V TAS  cosðDAÞ þ V wind  cosðWAÞ
DIS ¼ V GS Â DT
ð4Þ
Among them, DIS is the distance files per unit time, and MTK is the track angle.
4 Simulation Verification
4.1 Radar Data
The radar data from Shanghai terminal airspace is copied, and the radar track is
transferred to a computer-readable file (.txt) by controlling the playback function of the
automation system.
Extract historical radar data for a particular day’s flight, including location and
speed information for each flight at different times. According to the route and sector
division of the navigation data in Pu Dong Airport, the radar trajectory of the arrival
flight from the northwest on January 2, 2013, is analyzed, as shown in Fig. 4 (the thindotted line indicates the sector boundary and the thick-dotted line indicates the
approach route, the solid line indicates the radar trajectory).
4.2 Wind Vector
The GRIB grid data of the required Shanghai terminal area is tailored and processed
according to the flow chart shown in Fig. 1. The wind vector is shown in Fig. 5.
Application of GRIB Data for 4D Trajectory Prediction
427
the drift is related to the vacuum speed and the wind speed and the degree of crosswind.
The angle between the ground speed vector and the wind speed vector, that is, the
wind angle, indicates the extent to which the aircraft is subjected to the crosswind.
Taking the flight path as the reference, when the left-side wind is used, the flight path is
clockwise to the wind direction line, which is positive value, i.e. “+WA”; when the
right-side wind is used, the flight line is counterclockwise to the wind direction line,
which is negative value, i.e. “−WA.”
From the decomposition of the wind, we can know that: V wind  sin(WA) is the
crosswind component, which will make the flight path deviate from the heading line
and generate a bias flow, which will affect the navigation direction; V wind  cos(WA)
is the cis (inverse) wind component, which will affect the ground speed of the aircraft,
make the ground speed not equal to the vacuum speed, and affect the sailing time.
In the track prediction, since the wind directly exerts a force on the aircraft, a bias
flow and a windward wind component are generated, which affects the passing time of
the aircraft. During aircraft flight, according to the known wind direction and wind
speed, the bias flow and ground speed can be calculated, and the distance traveled per
unit time can be obtained:
WA ¼ u wind À MTK
DA ¼ arcsinðV wind =V TAS Â sinðWAÞÞ
V GS ¼ V TAS  cosðDAÞ þ V wind  cosðWAÞ
DIS ¼ V GS Â DT
ð4Þ
Among them, DIS is the distance files per unit time, and MTK is the track angle.
4 Simulation Verification
4.1 Radar Data
The radar data from Shanghai terminal airspace is copied, and the radar track is
transferred to a computer-readable file (.txt) by controlling the playback function of the
automation system.
Extract historical radar data for a particular day’s flight, including location and
speed information for each flight at different times. According to the route and sector
division of the navigation data in Pu Dong Airport, the radar trajectory of the arrival
flight from the northwest on January 2, 2013, is analyzed, as shown in Fig. 4 (the thindotted line indicates the sector boundary and the thick-dotted line indicates the
approach route, the solid line indicates the radar trajectory).
4.2 Wind Vector
The GRIB grid data of the required Shanghai terminal area is tailored and processed
according to the flow chart shown in Fig. 1. The wind vector is shown in Fig. 5.
Application of GRIB Data for 4D Trajectory Prediction
427