

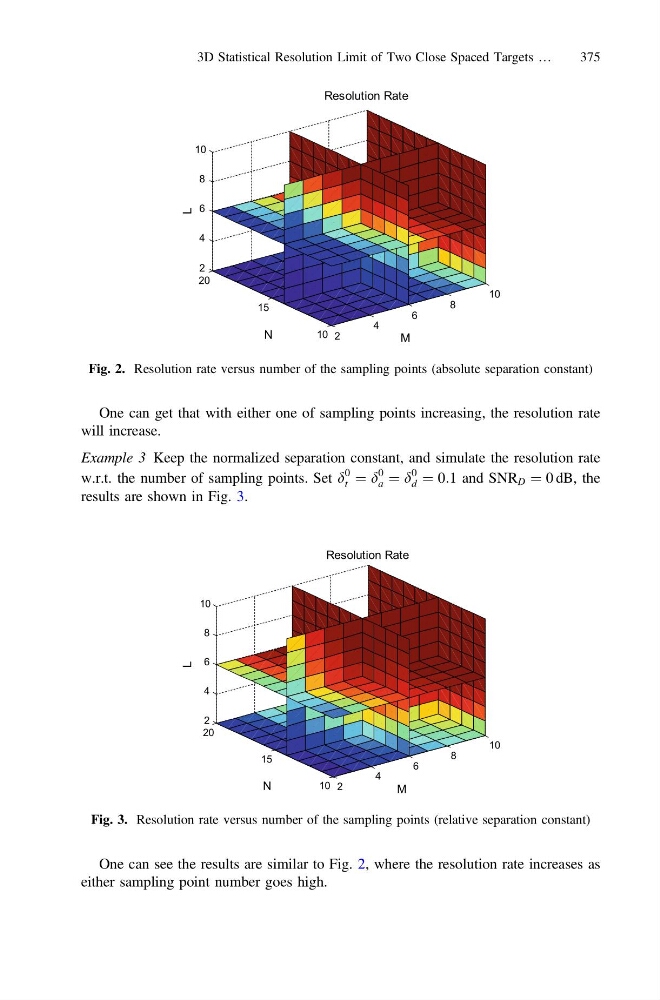
One can get that with either one of sampling points increasing, the resolution rate
will increase.
Example 3 Keep the normalized separation constant, and simulate the resolution rate
w.r.t. the number of sampling points. Set d
0
t ¼ d
0
a ¼ d
0
d ¼ 0:1 and SNR D ¼ 0 dB, the
results are shown in Fig. 3.
One can see the results are similar to Fig. 2, where the resolution rate increases as
either sampling point number goes high.
2
4
6
8
10
10
15
20
2
4
6
8
10
M
Resolution Rate
N
L
Fig. 2. Resolution rate versus number of the sampling points (absolute separation constant)
2
4
6
8
10
10
15
20
2
4
6
8
10
M
Resolution Rate
N
L
Fig. 3. Resolution rate versus number of the sampling points (relative separation constant)
3D Statistical Resolution Limit of Two Close Spaced Targets …
375
will increase.
Example 3 Keep the normalized separation constant, and simulate the resolution rate
w.r.t. the number of sampling points. Set d
0
t ¼ d
0
a ¼ d
0
d ¼ 0:1 and SNR D ¼ 0 dB, the
results are shown in Fig. 3.
One can see the results are similar to Fig. 2, where the resolution rate increases as
either sampling point number goes high.
2
4
6
8
10
10
15
20
2
4
6
8
10
M
Resolution Rate
N
L
Fig. 2. Resolution rate versus number of the sampling points (absolute separation constant)
2
4
6
8
10
10
15
20
2
4
6
8
10
M
Resolution Rate
N
L
Fig. 3. Resolution rate versus number of the sampling points (relative separation constant)
3D Statistical Resolution Limit of Two Close Spaced Targets …
375