

analysis is performed, the number of units in hidden layer is the optimal value in the
same timestep. When the number of units in hidden layer is performed, the timestep is
the optimal value in the same hidden layer.
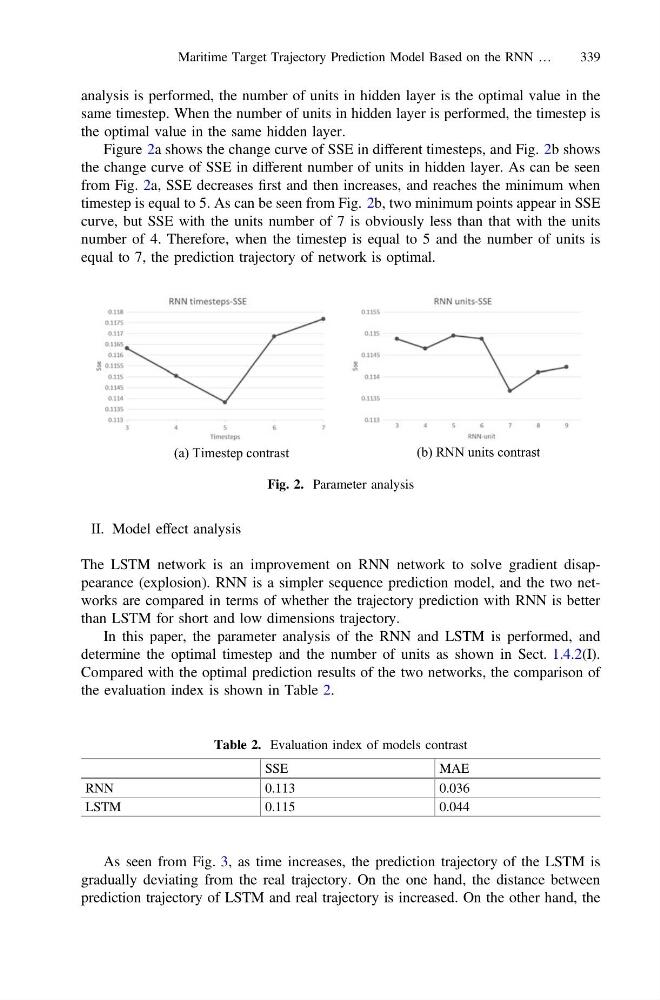
Figure 2a shows the change curve of SSE in different timesteps, and Fig. 2b shows
the change curve of SSE in different number of units in hidden layer. As can be seen
from Fig. 2a, SSE decreases first and then increases, and reaches the minimum when
timestep is equal to 5. As can be seen from Fig. 2b, two minimum points appear in SSE
curve, but SSE with the units number of 7 is obviously less than that with the units
number of 4. Therefore, when the timestep is equal to 5 and the number of units is
equal to 7, the prediction trajectory of network is optimal.
II. Model effect analysis
The LSTM network is an improvement on RNN network to solve gradient disappearance (explosion). RNN is a simpler sequence prediction model, and the two networks are compared in terms of whether the trajectory prediction with RNN is better
than LSTM for short and low dimensions trajectory.
In this paper, the parameter analysis of the RNN and LSTM is performed, and
determine the optimal timestep and the number of units as shown in Sect. 1.4.2(I).
Compared with the optimal prediction results of the two networks, the comparison of
the evaluation index is shown in Table 2.
As seen from Fig. 3, as time increases, the prediction trajectory of the LSTM is
gradually deviating from the real trajectory. On the one hand, the distance between
prediction trajectory of LSTM and real trajectory is increased. On the other hand, the
(a) Timestep contrast
(b) RNN units contrast
Fig. 2. Parameter analysis
Table 2. Evaluation index of models contrast
SSE
MAE
RNN
0.113
0.036
LSTM
0.115
0.044
Maritime Target Trajectory Prediction Model Based on the RNN …
339
same timestep. When the number of units in hidden layer is performed, the timestep is
the optimal value in the same hidden layer.
Figure 2a shows the change curve of SSE in different timesteps, and Fig. 2b shows
the change curve of SSE in different number of units in hidden layer. As can be seen
from Fig. 2a, SSE decreases first and then increases, and reaches the minimum when
timestep is equal to 5. As can be seen from Fig. 2b, two minimum points appear in SSE
curve, but SSE with the units number of 7 is obviously less than that with the units
number of 4. Therefore, when the timestep is equal to 5 and the number of units is
equal to 7, the prediction trajectory of network is optimal.
II. Model effect analysis
The LSTM network is an improvement on RNN network to solve gradient disappearance (explosion). RNN is a simpler sequence prediction model, and the two networks are compared in terms of whether the trajectory prediction with RNN is better
than LSTM for short and low dimensions trajectory.
In this paper, the parameter analysis of the RNN and LSTM is performed, and
determine the optimal timestep and the number of units as shown in Sect. 1.4.2(I).
Compared with the optimal prediction results of the two networks, the comparison of
the evaluation index is shown in Table 2.
As seen from Fig. 3, as time increases, the prediction trajectory of the LSTM is
gradually deviating from the real trajectory. On the one hand, the distance between
prediction trajectory of LSTM and real trajectory is increased. On the other hand, the
(a) Timestep contrast
(b) RNN units contrast
Fig. 2. Parameter analysis
Table 2. Evaluation index of models contrast
SSE
MAE
RNN
0.113
0.036
LSTM
0.115
0.044
Maritime Target Trajectory Prediction Model Based on the RNN …
339