

3 Validation Results
3.1 Results of Simulated Data
Three groups of different K-distribution parameters are, respectively, estimated by
training the corresponding full-connected neural network. The simulation data was
4096 dimension, which was processed into 1000 dimension by histogram statistical
method, with the numerical range of 0–10 and the interval length of 0.01. The neural
network used is two 4-layer deep networks, with 1000 neurons in each input layer,
1000 neurons in each hidden layer and 1 neuron in each output layer. For each
parameter, the corresponding neural network was trained.
The neural network uses the quadrature cost function, AdaOptimizer, learning rate
0.002, batch size 50, and 20,000 iterations. The K-distribution adopts the second-order
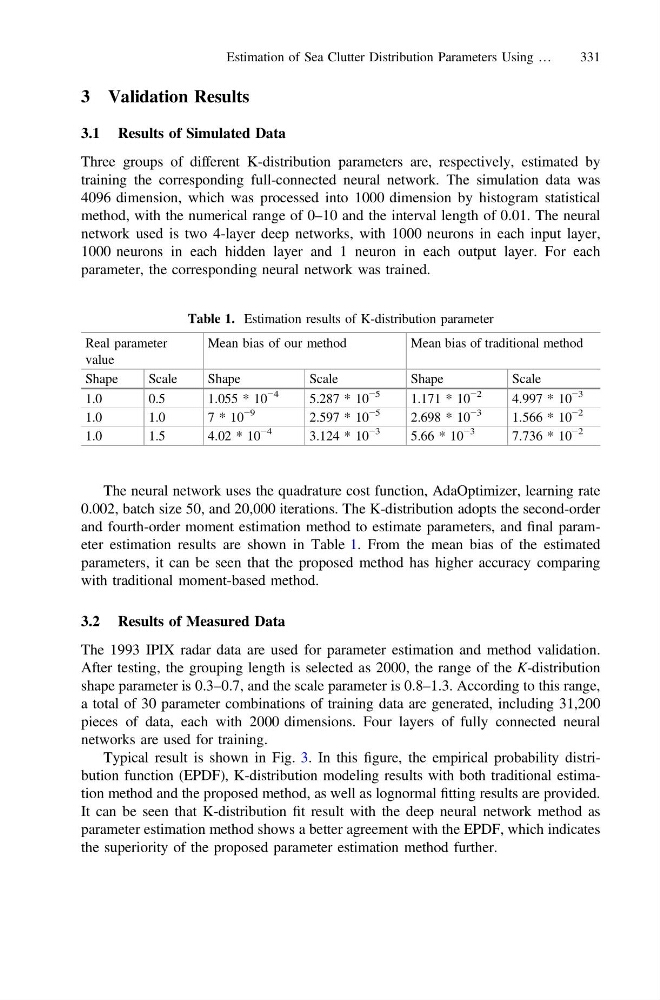
and fourth-order moment estimation method to estimate parameters, and final parameter estimation results are shown in Table 1. From the mean bias of the estimated
parameters, it can be seen that the proposed method has higher accuracy comparing
with traditional moment-based method.
3.2 Results of Measured Data
The 1993 IPIX radar data are used for parameter estimation and method validation.
After testing, the grouping length is selected as 2000, the range of the K-distribution
shape parameter is 0.3–0.7, and the scale parameter is 0.8–1.3. According to this range,
a total of 30 parameter combinations of training data are generated, including 31,200
pieces of data, each with 2000 dimensions. Four layers of fully connected neural
networks are used for training.
Typical result is shown in Fig. 3. In this figure, the empirical probability distribution function (EPDF), K-distribution modeling results with both traditional estimation method and the proposed method, as well as lognormal fitting results are provided.
It can be seen that K-distribution fit result with the deep neural network method as
parameter estimation method shows a better agreement with the EPDF, which indicates
the superiority of the proposed parameter estimation method further.
Table 1. Estimation results of K-distribution parameter
Real parameter
value
Mean bias of our method
Mean bias of traditional method
Shape
Scale
Shape
Scale
Shape
Scale
1.0
0.5
1.055 * 10
−4
5.287 * 10
−5
1.171 * 10
−2
4.997 * 10
−3
1.0
1.0
7 * 10
−9
2.597 * 10
−5
2.698 * 10
−3
1.566 * 10
−2
1.0
1.5
4.02 * 10
−4
3.124 * 10
−3
5.66 * 10
−3
7.736 * 10
−2
Estimation of Sea Clutter Distribution Parameters Using …
331
3.1 Results of Simulated Data
Three groups of different K-distribution parameters are, respectively, estimated by
training the corresponding full-connected neural network. The simulation data was
4096 dimension, which was processed into 1000 dimension by histogram statistical
method, with the numerical range of 0–10 and the interval length of 0.01. The neural
network used is two 4-layer deep networks, with 1000 neurons in each input layer,
1000 neurons in each hidden layer and 1 neuron in each output layer. For each
parameter, the corresponding neural network was trained.
The neural network uses the quadrature cost function, AdaOptimizer, learning rate
0.002, batch size 50, and 20,000 iterations. The K-distribution adopts the second-order
and fourth-order moment estimation method to estimate parameters, and final parameter estimation results are shown in Table 1. From the mean bias of the estimated
parameters, it can be seen that the proposed method has higher accuracy comparing
with traditional moment-based method.
3.2 Results of Measured Data
The 1993 IPIX radar data are used for parameter estimation and method validation.
After testing, the grouping length is selected as 2000, the range of the K-distribution
shape parameter is 0.3–0.7, and the scale parameter is 0.8–1.3. According to this range,
a total of 30 parameter combinations of training data are generated, including 31,200
pieces of data, each with 2000 dimensions. Four layers of fully connected neural
networks are used for training.
Typical result is shown in Fig. 3. In this figure, the empirical probability distribution function (EPDF), K-distribution modeling results with both traditional estimation method and the proposed method, as well as lognormal fitting results are provided.
It can be seen that K-distribution fit result with the deep neural network method as
parameter estimation method shows a better agreement with the EPDF, which indicates
the superiority of the proposed parameter estimation method further.
Table 1. Estimation results of K-distribution parameter
Real parameter
value
Mean bias of our method
Mean bias of traditional method
Shape
Scale
Shape
Scale
Shape
Scale
1.0
0.5
1.055 * 10
−4
5.287 * 10
−5
1.171 * 10
−2
4.997 * 10
−3
1.0
1.0
7 * 10
−9
2.597 * 10
−5
2.698 * 10
−3
1.566 * 10
−2
1.0
1.5
4.02 * 10
−4
3.124 * 10
−3
5.66 * 10
−3
7.736 * 10
−2
Estimation of Sea Clutter Distribution Parameters Using …
331