

(5) The input test data is used to test the trained network model, and the estimated
results of the neural network are obtained. The results are compared with the
estimated results of mathematical statistics methods, and the average deviation of
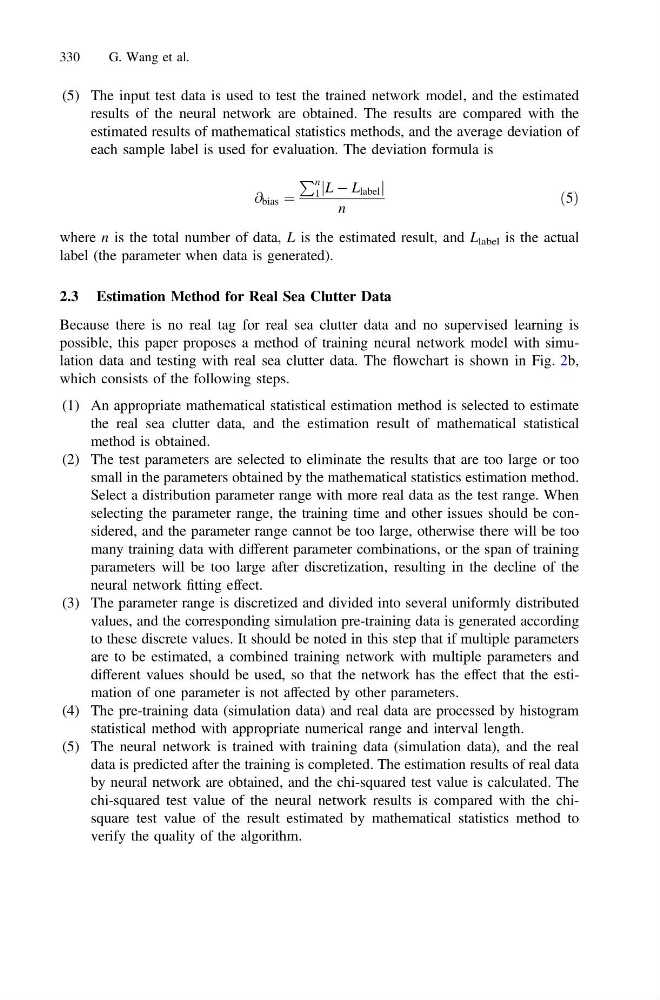
each sample label is used for evaluation. The deviation formula is
@ bias ¼
P n
1 L À L label
j
j
n
ð5Þ
where n is the total number of data, L is the estimated result, and L label is the actual
label (the parameter when data is generated).
2.3 Estimation Method for Real Sea Clutter Data
Because there is no real tag for real sea clutter data and no supervised learning is
possible, this paper proposes a method of training neural network model with simulation data and testing with real sea clutter data. The flowchart is shown in Fig. 2b,
which consists of the following steps.
(1) An appropriate mathematical statistical estimation method is selected to estimate
the real sea clutter data, and the estimation result of mathematical statistical
method is obtained.
(2) The test parameters are selected to eliminate the results that are too large or too
small in the parameters obtained by the mathematical statistics estimation method.
Select a distribution parameter range with more real data as the test range. When
selecting the parameter range, the training time and other issues should be considered, and the parameter range cannot be too large, otherwise there will be too
many training data with different parameter combinations, or the span of training
parameters will be too large after discretization, resulting in the decline of the
neural network fitting effect.
(3) The parameter range is discretized and divided into several uniformly distributed
values, and the corresponding simulation pre-training data is generated according
to these discrete values. It should be noted in this step that if multiple parameters
are to be estimated, a combined training network with multiple parameters and
different values should be used, so that the network has the effect that the estimation of one parameter is not affected by other parameters.
(4) The pre-training data (simulation data) and real data are processed by histogram
statistical method with appropriate numerical range and interval length.
(5) The neural network is trained with training data (simulation data), and the real
data is predicted after the training is completed. The estimation results of real data
by neural network are obtained, and the chi-squared test value is calculated. The
chi-squared test value of the neural network results is compared with the chisquare test value of the result estimated by mathematical statistics method to
verify the quality of the algorithm.
330
G. Wang et al.
results of the neural network are obtained. The results are compared with the
estimated results of mathematical statistics methods, and the average deviation of
each sample label is used for evaluation. The deviation formula is
@ bias ¼
P n
1 L À L label
j
j
n
ð5Þ
where n is the total number of data, L is the estimated result, and L label is the actual
label (the parameter when data is generated).
2.3 Estimation Method for Real Sea Clutter Data
Because there is no real tag for real sea clutter data and no supervised learning is
possible, this paper proposes a method of training neural network model with simulation data and testing with real sea clutter data. The flowchart is shown in Fig. 2b,
which consists of the following steps.
(1) An appropriate mathematical statistical estimation method is selected to estimate
the real sea clutter data, and the estimation result of mathematical statistical
method is obtained.
(2) The test parameters are selected to eliminate the results that are too large or too
small in the parameters obtained by the mathematical statistics estimation method.
Select a distribution parameter range with more real data as the test range. When
selecting the parameter range, the training time and other issues should be considered, and the parameter range cannot be too large, otherwise there will be too
many training data with different parameter combinations, or the span of training
parameters will be too large after discretization, resulting in the decline of the
neural network fitting effect.
(3) The parameter range is discretized and divided into several uniformly distributed
values, and the corresponding simulation pre-training data is generated according
to these discrete values. It should be noted in this step that if multiple parameters
are to be estimated, a combined training network with multiple parameters and
different values should be used, so that the network has the effect that the estimation of one parameter is not affected by other parameters.
(4) The pre-training data (simulation data) and real data are processed by histogram
statistical method with appropriate numerical range and interval length.
(5) The neural network is trained with training data (simulation data), and the real
data is predicted after the training is completed. The estimation results of real data
by neural network are obtained, and the chi-squared test value is calculated. The
chi-squared test value of the neural network results is compared with the chisquare test value of the result estimated by mathematical statistics method to
verify the quality of the algorithm.
330
G. Wang et al.