

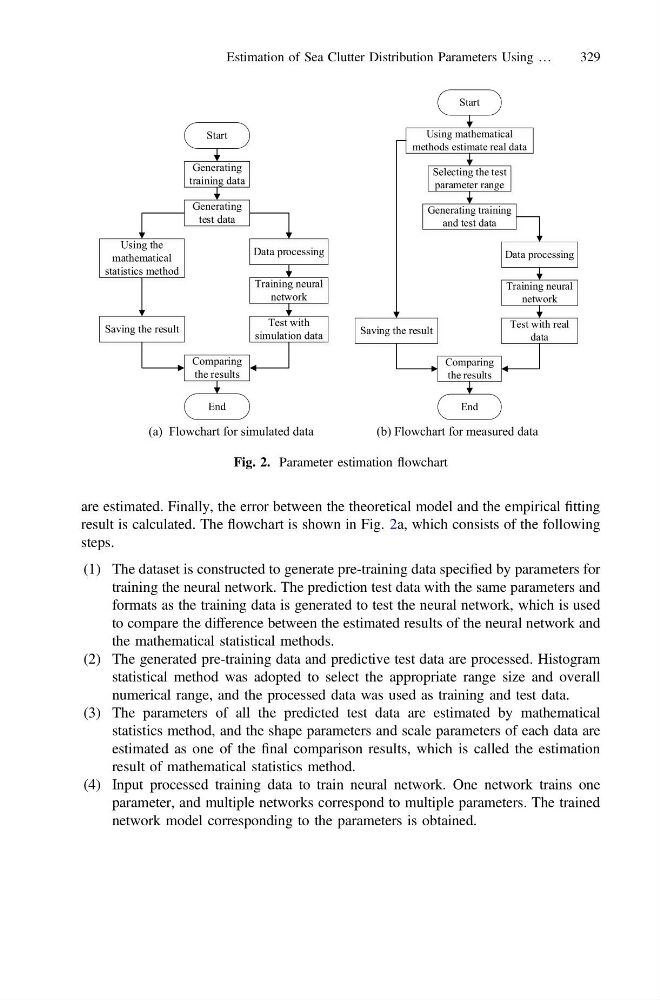
are estimated. Finally, the error between the theoretical model and the empirical fitting
result is calculated. The flowchart is shown in Fig. 2a, which consists of the following
steps.
(1) The dataset is constructed to generate pre-training data specified by parameters for
training the neural network. The prediction test data with the same parameters and
formats as the training data is generated to test the neural network, which is used
to compare the difference between the estimated results of the neural network and
the mathematical statistical methods.
(2) The generated pre-training data and predictive test data are processed. Histogram
statistical method was adopted to select the appropriate range size and overall
numerical range, and the processed data was used as training and test data.
(3) The parameters of all the predicted test data are estimated by mathematical
statistics method, and the shape parameters and scale parameters of each data are
estimated as one of the final comparison results, which is called the estimation
result of mathematical statistics method.
(4) Input processed training data to train neural network. One network trains one
parameter, and multiple networks correspond to multiple parameters. The trained
network model corresponding to the parameters is obtained.
Generating
training data
Comparing
the results
Data processing
Training neural
network
Test with
simulation data
Generating
test data
Using the
mathematical
statistics method
Saving the result
Start
End
Comparing
the results
Data processing
Training neural
network
Test with real
data
Generating training
and test data
Saving the result
Using mathematical
methods estimate real data
Selecting the test
parameter range
Start
End
(a) Flowchart for simulated data
(b) Flowchart for measured data
Fig. 2. Parameter estimation flowchart
Estimation of Sea Clutter Distribution Parameters Using …
329
result is calculated. The flowchart is shown in Fig. 2a, which consists of the following
steps.
(1) The dataset is constructed to generate pre-training data specified by parameters for
training the neural network. The prediction test data with the same parameters and
formats as the training data is generated to test the neural network, which is used
to compare the difference between the estimated results of the neural network and
the mathematical statistical methods.
(2) The generated pre-training data and predictive test data are processed. Histogram
statistical method was adopted to select the appropriate range size and overall
numerical range, and the processed data was used as training and test data.
(3) The parameters of all the predicted test data are estimated by mathematical
statistics method, and the shape parameters and scale parameters of each data are
estimated as one of the final comparison results, which is called the estimation
result of mathematical statistics method.
(4) Input processed training data to train neural network. One network trains one
parameter, and multiple networks correspond to multiple parameters. The trained
network model corresponding to the parameters is obtained.
Generating
training data
Comparing
the results
Data processing
Training neural
network
Test with
simulation data
Generating
test data
Using the
mathematical
statistics method
Saving the result
Start
End
Comparing
the results
Data processing
Training neural
network
Test with real
data
Generating training
and test data
Saving the result
Using mathematical
methods estimate real data
Selecting the test
parameter range
Start
End
(a) Flowchart for simulated data
(b) Flowchart for measured data
Fig. 2. Parameter estimation flowchart
Estimation of Sea Clutter Distribution Parameters Using …
329