

REPTree. It can be concluded that ensemble learning has some advantages over single
classification algorithm in dealing with small sample sets, but advantages are not
significant.
4.4 Comparison Experiment with Rejection
When considering rejection, the performance evaluation of classification algorithm
becomes more complex. It is not enough to explain the problem comprehensively and
deeply only by the classification accuracy. Two indicators are defined as follows, the
first is the classification accuracy of the samples to be tested
P cc ¼ 100% Â N cc =N de
ð5Þ
The second is the judgment rate of the sample to be tested
P dec ¼ 100% Â N dec =N all
ð6Þ
where N all is the total number of samples to be tested, N dec is number of samples that
have been classified; N cc is the number of samples that have classified correctly. There is
a compromise between P cc and P dec . Generally, the larger the P dec , the smaller the P cc .
When rejection experiments are carried out, the influences of label noise and small
sample set are taken into consideration. Bagging and REPTree are compared with each
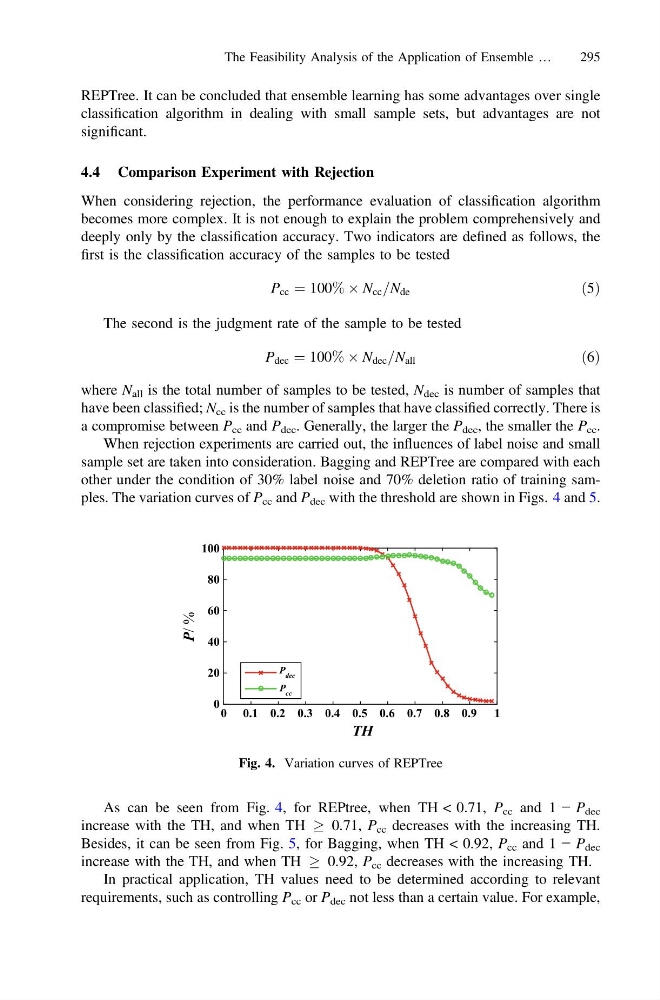
other under the condition of 30% label noise and 70% deletion ratio of training samples. The variation curves of P cc and P dec with the threshold are shown in Figs. 4 and 5.
As can be seen from Fig. 4, for REPtree, when TH < 0.71, P cc and 1 − P dec
increase with the TH, and when TH ! 0.71, P cc decreases with the increasing TH.
Besides, it can be seen from Fig. 5, for Bagging, when TH < 0.92, P cc and 1 − P dec
increase with the TH, and when TH ! 0.92, P cc decreases with the increasing TH.
In practical application, TH values need to be determined according to relevant
requirements, such as controlling P cc or P dec not less than a certain value. For example,
1
TH
0
20
40
60
80
100
P/ %
P dec
P cc
0 0.1 0.2 0.3 0.4 0.5 0.6 0.7 0.8 0.9
Fig. 4. Variation curves of REPTree
The Feasibility Analysis of the Application of Ensemble …
295
classification algorithm in dealing with small sample sets, but advantages are not
significant.
4.4 Comparison Experiment with Rejection
When considering rejection, the performance evaluation of classification algorithm
becomes more complex. It is not enough to explain the problem comprehensively and
deeply only by the classification accuracy. Two indicators are defined as follows, the
first is the classification accuracy of the samples to be tested
P cc ¼ 100% Â N cc =N de
ð5Þ
The second is the judgment rate of the sample to be tested
P dec ¼ 100% Â N dec =N all
ð6Þ
where N all is the total number of samples to be tested, N dec is number of samples that
have been classified; N cc is the number of samples that have classified correctly. There is
a compromise between P cc and P dec . Generally, the larger the P dec , the smaller the P cc .
When rejection experiments are carried out, the influences of label noise and small
sample set are taken into consideration. Bagging and REPTree are compared with each
other under the condition of 30% label noise and 70% deletion ratio of training samples. The variation curves of P cc and P dec with the threshold are shown in Figs. 4 and 5.
As can be seen from Fig. 4, for REPtree, when TH < 0.71, P cc and 1 − P dec
increase with the TH, and when TH ! 0.71, P cc decreases with the increasing TH.
Besides, it can be seen from Fig. 5, for Bagging, when TH < 0.92, P cc and 1 − P dec
increase with the TH, and when TH ! 0.92, P cc decreases with the increasing TH.
In practical application, TH values need to be determined according to relevant
requirements, such as controlling P cc or P dec not less than a certain value. For example,
1
TH
0
20
40
60
80
100
P/ %
P dec
P cc
0 0.1 0.2 0.3 0.4 0.5 0.6 0.7 0.8 0.9
Fig. 4. Variation curves of REPTree
The Feasibility Analysis of the Application of Ensemble …
295