

Using single-sample data to make predictions after training, the accuracy is very
high, but the generality is insufficient. So we did the second test. The goal is to use a
small amount of data for transfer learning to achieve better result. First, all data is
divided into training set and test set by sample, and the data of all samples in the
training set are used for preliminary training to obtain a basic model. Then, for each test
sample in the test set, a small amount of data is taken out in order to perform a transfer
learning. After the completion, blood pressure estimation can be performed for the test
sample. Table 2 shows the test results.
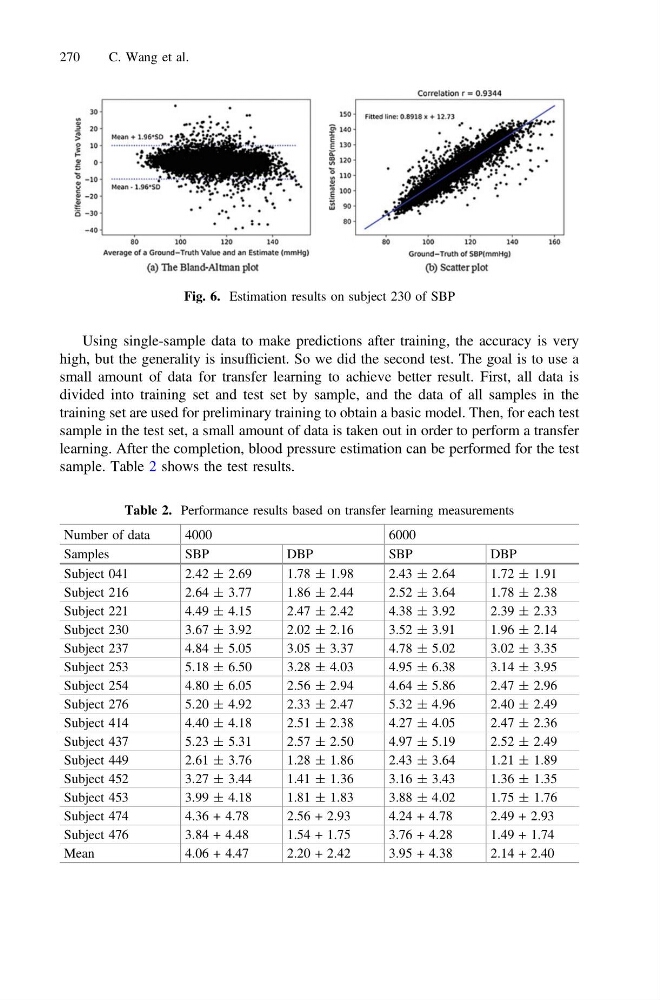
Fig. 6. Estimation results on subject 230 of SBP
Table 2. Performance results based on transfer learning measurements
Number of data
4000
6000
Samples
SBP
DBP
SBP
DBP
Subject 041
2.42 ± 2.69
1.78 ± 1.98
2.43 ± 2.64
1.72 ± 1.91
Subject 216
2.64 ± 3.77
1.86 ± 2.44
2.52 ± 3.64
1.78 ± 2.38
Subject 221
4.49 ± 4.15
2.47 ± 2.42
4.38 ± 3.92
2.39 ± 2.33
Subject 230
3.67 ± 3.92
2.02 ± 2.16
3.52 ± 3.91
1.96 ± 2.14
Subject 237
4.84 ± 5.05
3.05 ± 3.37
4.78 ± 5.02
3.02 ± 3.35
Subject 253
5.18 ± 6.50
3.28 ± 4.03
4.95 ± 6.38
3.14 ± 3.95
Subject 254
4.80 ± 6.05
2.56 ± 2.94
4.64 ± 5.86
2.47 ± 2.96
Subject 276
5.20 ± 4.92
2.33 ± 2.47
5.32 ± 4.96
2.40 ± 2.49
Subject 414
4.40 ± 4.18
2.51 ± 2.38
4.27 ± 4.05
2.47 ± 2.36
Subject 437
5.23 ± 5.31
2.57 ± 2.50
4.97 ± 5.19
2.52 ± 2.49
Subject 449
2.61 ± 3.76
1.28 ± 1.86
2.43 ± 3.64
1.21 ± 1.89
Subject 452
3.27 ± 3.44
1.41 ± 1.36
3.16 ± 3.43
1.36 ± 1.35
Subject 453
3.99 ± 4.18
1.81 ± 1.83
3.88 ± 4.02
1.75 ± 1.76
Subject 474
4.36 + 4.78
2.56 + 2.93
4.24 + 4.78
2.49 + 2.93
Subject 476
3.84 + 4.48
1.54 + 1.75
3.76 + 4.28
1.49 + 1.74
Mean
4.06 + 4.47
2.20 + 2.42
3.95 + 4.38
2.14 + 2.40
270
C. Wang et al.
high, but the generality is insufficient. So we did the second test. The goal is to use a
small amount of data for transfer learning to achieve better result. First, all data is
divided into training set and test set by sample, and the data of all samples in the
training set are used for preliminary training to obtain a basic model. Then, for each test
sample in the test set, a small amount of data is taken out in order to perform a transfer
learning. After the completion, blood pressure estimation can be performed for the test
sample. Table 2 shows the test results.
Fig. 6. Estimation results on subject 230 of SBP
Table 2. Performance results based on transfer learning measurements
Number of data
4000
6000
Samples
SBP
DBP
SBP
DBP
Subject 041
2.42 ± 2.69
1.78 ± 1.98
2.43 ± 2.64
1.72 ± 1.91
Subject 216
2.64 ± 3.77
1.86 ± 2.44
2.52 ± 3.64
1.78 ± 2.38
Subject 221
4.49 ± 4.15
2.47 ± 2.42
4.38 ± 3.92
2.39 ± 2.33
Subject 230
3.67 ± 3.92
2.02 ± 2.16
3.52 ± 3.91
1.96 ± 2.14
Subject 237
4.84 ± 5.05
3.05 ± 3.37
4.78 ± 5.02
3.02 ± 3.35
Subject 253
5.18 ± 6.50
3.28 ± 4.03
4.95 ± 6.38
3.14 ± 3.95
Subject 254
4.80 ± 6.05
2.56 ± 2.94
4.64 ± 5.86
2.47 ± 2.96
Subject 276
5.20 ± 4.92
2.33 ± 2.47
5.32 ± 4.96
2.40 ± 2.49
Subject 414
4.40 ± 4.18
2.51 ± 2.38
4.27 ± 4.05
2.47 ± 2.36
Subject 437
5.23 ± 5.31
2.57 ± 2.50
4.97 ± 5.19
2.52 ± 2.49
Subject 449
2.61 ± 3.76
1.28 ± 1.86
2.43 ± 3.64
1.21 ± 1.89
Subject 452
3.27 ± 3.44
1.41 ± 1.36
3.16 ± 3.43
1.36 ± 1.35
Subject 453
3.99 ± 4.18
1.81 ± 1.83
3.88 ± 4.02
1.75 ± 1.76
Subject 474
4.36 + 4.78
2.56 + 2.93
4.24 + 4.78
2.49 + 2.93
Subject 476
3.84 + 4.48
1.54 + 1.75
3.76 + 4.28
1.49 + 1.74
Mean
4.06 + 4.47
2.20 + 2.42
3.95 + 4.38
2.14 + 2.40
270
C. Wang et al.