

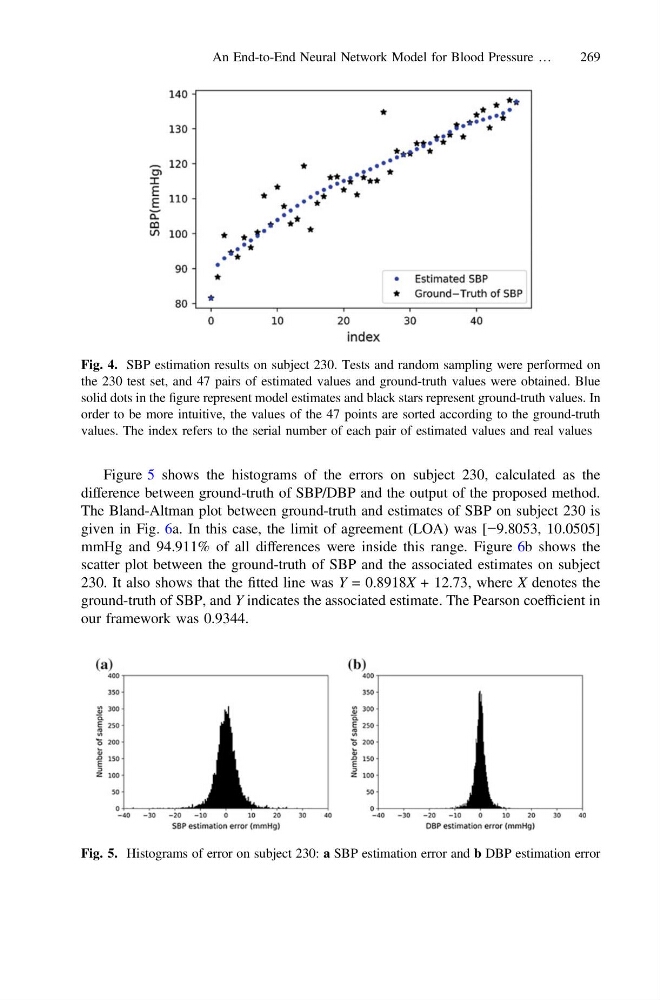
Figure 5 shows the histograms of the errors on subject 230, calculated as the
difference between ground-truth of SBP/DBP and the output of the proposed method.
The Bland-Altman plot between ground-truth and estimates of SBP on subject 230 is
given in Fig. 6a. In this case, the limit of agreement (LOA) was [−9.8053, 10.0505]
mmHg and 94.911% of all differences were inside this range. Figure 6b shows the
scatter plot between the ground-truth of SBP and the associated estimates on subject
230. It also shows that the fitted line was Y = 0.8918X + 12.73, where X denotes the
ground-truth of SBP, and Y indicates the associated estimate. The Pearson coefficient in
our framework was 0.9344.
Fig. 4. SBP estimation results on subject 230. Tests and random sampling were performed on
the 230 test set, and 47 pairs of estimated values and ground-truth values were obtained. Blue
solid dots in the figure represent model estimates and black stars represent ground-truth values. In
order to be more intuitive, the values of the 47 points are sorted according to the ground-truth
values. The index refers to the serial number of each pair of estimated values and real values
Fig. 5. Histograms of error on subject 230: a SBP estimation error and b DBP estimation error
An End-to-End Neural Network Model for Blood Pressure …
269
difference between ground-truth of SBP/DBP and the output of the proposed method.
The Bland-Altman plot between ground-truth and estimates of SBP on subject 230 is
given in Fig. 6a. In this case, the limit of agreement (LOA) was [−9.8053, 10.0505]
mmHg and 94.911% of all differences were inside this range. Figure 6b shows the
scatter plot between the ground-truth of SBP and the associated estimates on subject
230. It also shows that the fitted line was Y = 0.8918X + 12.73, where X denotes the
ground-truth of SBP, and Y indicates the associated estimate. The Pearson coefficient in
our framework was 0.9344.
Fig. 4. SBP estimation results on subject 230. Tests and random sampling were performed on
the 230 test set, and 47 pairs of estimated values and ground-truth values were obtained. Blue
solid dots in the figure represent model estimates and black stars represent ground-truth values. In
order to be more intuitive, the values of the 47 points are sorted according to the ground-truth
values. The index refers to the serial number of each pair of estimated values and real values
Fig. 5. Histograms of error on subject 230: a SBP estimation error and b DBP estimation error
An End-to-End Neural Network Model for Blood Pressure …
269