

The absolute error is used as an evaluation criterion in this experiment. The calculation formula is:
e ¼ BP est À BP
j
j
ð1Þ
where BP est is the estimated SBP or DBP using the proposed method, and BP is the
reference value obtained from MIMIC database. The Bland-Altman plot [23] is another
evaluation indicator to test the consistency between ground-truth and estimates. It
shows the difference between each estimate and the associated ground-truth against
their average. In this analysis limit of agreement (LOA) is also calculated, which is
defined as [µ − 1.96r, µ + 1.96r], where µ is the average of the difference and r is the
standard deviation. Pearson correlation between ground-truth and estimated SBP is also
used as one of the performance indices.
The average absolute error on the test set of subject 230 is 3.81 ± 3.90 mmHg for
SBP, and 1.74 ± 2.28 mmHg for DBP, which both are meeting the requirement.
Figure 4 presents the results of several estimated SBP on the test set of subject 230
using the proposed method. Tests are performed on all test samples and 5640 test
values are obtained. In order to be more intuitive in the figures, the obtained test values
are sorted, and then one point is taken at intervals of 120 points. Finally, 47 points are
taken and plotted in the figure. The corresponding point of ground-truth SBP is also
plotted in the figure. It can be seen that most of the estimates are close to the groundtruth, showing the proposed method effective.
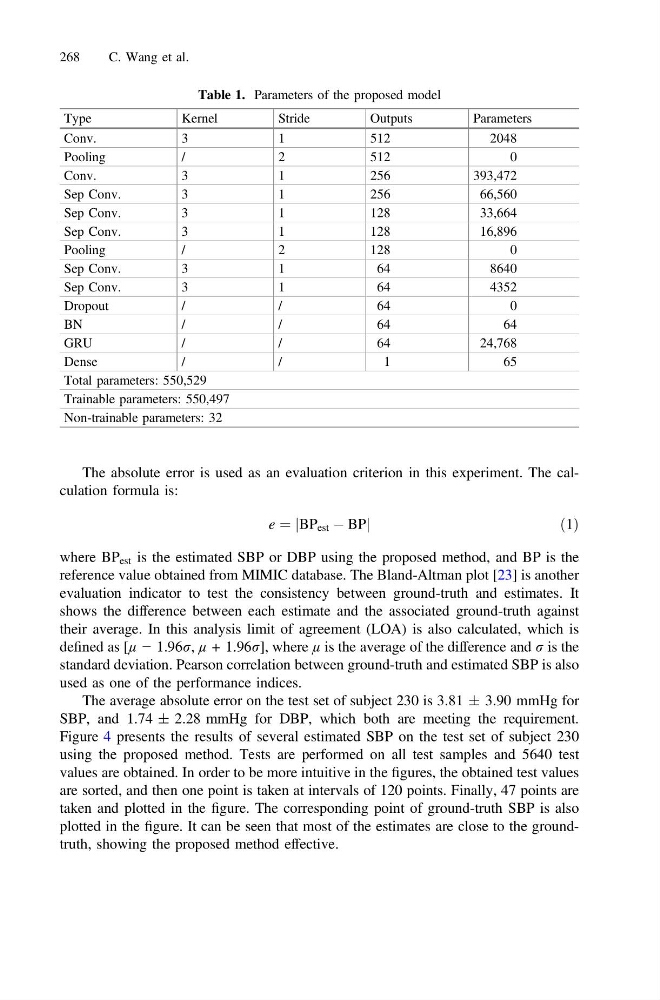
Table 1. Parameters of the proposed model
Type
Kernel
Stride
Outputs
Parameters
Conv.
3
1
512
2048
Pooling
/
2
512
0
Conv.
3
1
256
393,472
Sep Conv.
3
1
256
66,560
Sep Conv.
3
1
128
33,664
Sep Conv.
3
1
128
16,896
Pooling
/
2
128
0
Sep Conv.
3
1
64
8640
Sep Conv.
3
1
64
4352
Dropout
/
/
64
0
BN
/
/
64
64
GRU
/
/
64
24,768
Dense
/
/
1
65
Total parameters: 550,529
Trainable parameters: 550,497
Non-trainable parameters: 32
268
C. Wang et al.
e ¼ BP est À BP
j
j
ð1Þ
where BP est is the estimated SBP or DBP using the proposed method, and BP is the
reference value obtained from MIMIC database. The Bland-Altman plot [23] is another
evaluation indicator to test the consistency between ground-truth and estimates. It
shows the difference between each estimate and the associated ground-truth against
their average. In this analysis limit of agreement (LOA) is also calculated, which is
defined as [µ − 1.96r, µ + 1.96r], where µ is the average of the difference and r is the
standard deviation. Pearson correlation between ground-truth and estimated SBP is also
used as one of the performance indices.
The average absolute error on the test set of subject 230 is 3.81 ± 3.90 mmHg for
SBP, and 1.74 ± 2.28 mmHg for DBP, which both are meeting the requirement.
Figure 4 presents the results of several estimated SBP on the test set of subject 230
using the proposed method. Tests are performed on all test samples and 5640 test
values are obtained. In order to be more intuitive in the figures, the obtained test values
are sorted, and then one point is taken at intervals of 120 points. Finally, 47 points are
taken and plotted in the figure. The corresponding point of ground-truth SBP is also
plotted in the figure. It can be seen that most of the estimates are close to the groundtruth, showing the proposed method effective.
Table 1. Parameters of the proposed model
Type
Kernel
Stride
Outputs
Parameters
Conv.
3
1
512
2048
Pooling
/
2
512
0
Conv.
3
1
256
393,472
Sep Conv.
3
1
256
66,560
Sep Conv.
3
1
128
33,664
Sep Conv.
3
1
128
16,896
Pooling
/
2
128
0
Sep Conv.
3
1
64
8640
Sep Conv.
3
1
64
4352
Dropout
/
/
64
0
BN
/
/
64
64
GRU
/
/
64
24,768
Dense
/
/
1
65
Total parameters: 550,529
Trainable parameters: 550,497
Non-trainable parameters: 32
268
C. Wang et al.