

118
Y. Qin et al.
Table 2. Hardware configuration of Experiment I
group no computer model Character Number cores number
1
TF Z01
Worker
1
8 cores
2
Lenovo T530
Worker
3
4 cores
3
Lenovo ER202 Worker
4
2 cores
4
Asus X550V
Driver
1
4 cores
Table 3. Result of Experiment I.
No.
computer 1 (s) computer 2 (s) computer 3 (s) computer 4 (s) average time (s)
group 1 12.846
12.846
group 2 26.518
27.156
25.984
26.553
group 3 54.194
54.642
56.158
55.110
55.026
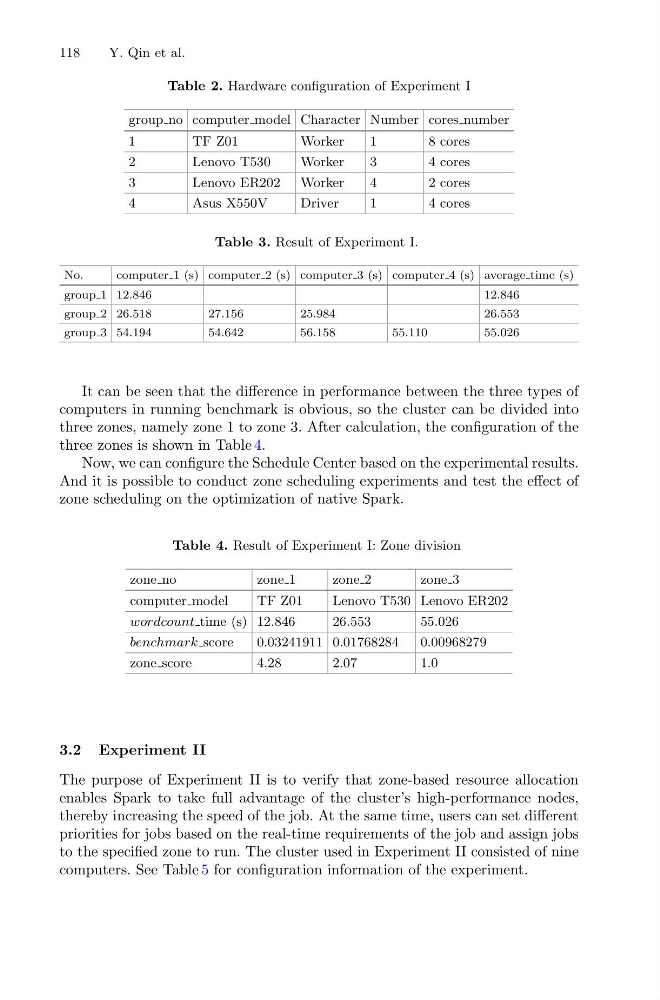
It can be seen that the difference in performance between the three types of
computers in running benchmark is obvious, so the cluster can be divided into
three zones, namely zone 1 to zone 3. After calculation, the configuration of the
three zones is shown in Table 4.
Now, we can configure the Schedule Center based on the experimental results.
And it is possible to conduct zone scheduling experiments and test the effect of
zone scheduling on the optimization of native Spark.
Table 4. Result of Experiment I: Zone division
zone no
zone 1
zone 2
zone 3
computer model
TF Z01
Lenovo T530 Lenovo ER202
wordcount time (s) 12.846
26.553
55.026
benchmark score
0.03241911 0.01768284
0.00968279
zone score
4.28
2.07
1.0
3.2 Experiment II
The purpose of Experiment II is to verify that zone-based resource allocation
enables Spark to take full advantage of the cluster’s high-performance nodes,
thereby increasing the speed of the job. At the same time, users can set different
priorities for jobs based on the real-time requirements of the job and assign jobs
to the specified zone to run. The cluster used in Experiment II consisted of nine
computers. See Table 5 for configuration information of the experiment.
Y. Qin et al.
Table 2. Hardware configuration of Experiment I
group no computer model Character Number cores number
1
TF Z01
Worker
1
8 cores
2
Lenovo T530
Worker
3
4 cores
3
Lenovo ER202 Worker
4
2 cores
4
Asus X550V
Driver
1
4 cores
Table 3. Result of Experiment I.
No.
computer 1 (s) computer 2 (s) computer 3 (s) computer 4 (s) average time (s)
group 1 12.846
12.846
group 2 26.518
27.156
25.984
26.553
group 3 54.194
54.642
56.158
55.110
55.026
It can be seen that the difference in performance between the three types of
computers in running benchmark is obvious, so the cluster can be divided into
three zones, namely zone 1 to zone 3. After calculation, the configuration of the
three zones is shown in Table 4.
Now, we can configure the Schedule Center based on the experimental results.
And it is possible to conduct zone scheduling experiments and test the effect of
zone scheduling on the optimization of native Spark.
Table 4. Result of Experiment I: Zone division
zone no
zone 1
zone 2
zone 3
computer model
TF Z01
Lenovo T530 Lenovo ER202
wordcount time (s) 12.846
26.553
55.026
benchmark score
0.03241911 0.01768284
0.00968279
zone score
4.28
2.07
1.0
3.2 Experiment II
The purpose of Experiment II is to verify that zone-based resource allocation
enables Spark to take full advantage of the cluster’s high-performance nodes,
thereby increasing the speed of the job. At the same time, users can set different
priorities for jobs based on the real-time requirements of the job and assign jobs
to the specified zone to run. The cluster used in Experiment II consisted of nine
computers. See Table 5 for configuration information of the experiment.