

272
23 Coordinate Systems
23.2.2 Ellipsoidal Coordinates and Cone Coordinates
The SPECFUNPHYS function edal2c serves for the transformation of the
ellipsoidal coordinates to cartesian coordinates and the SPECFUNPHYS function
cone2c for the transformation from cone coordinates to cartesian coordinates.
edal2c The syntax of the function edal2c is [x,y,z] = edal2c(mu,nu,
rho,a) and coordinate transformation is given by Eqs. (23.24). The coordinate
values “mu, nu, rho” are either of the same size or scalar values. “a” (optional) is a
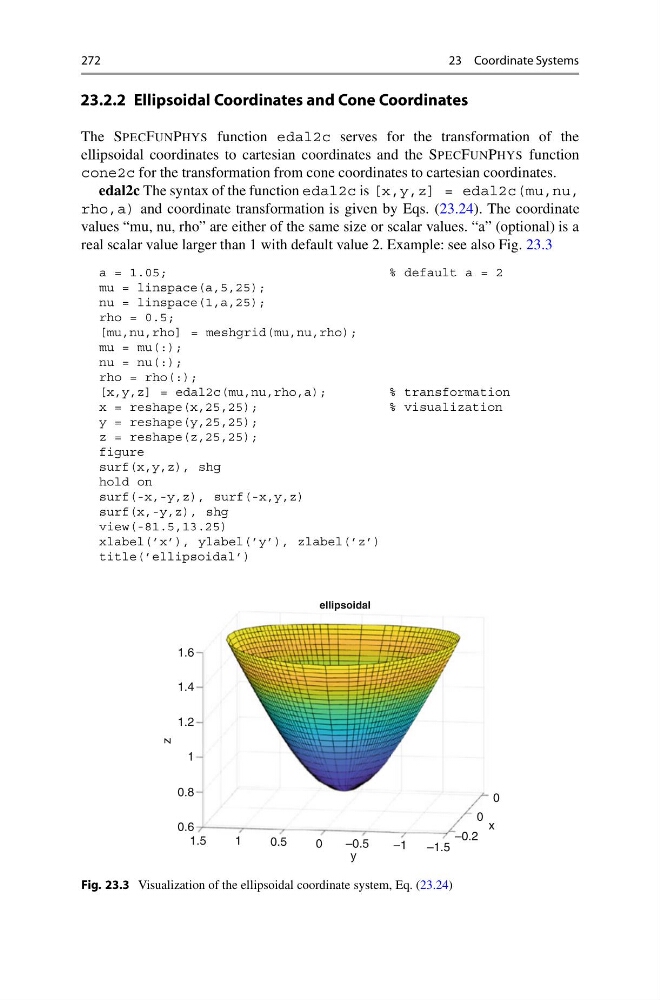
real scalar value larger than 1 with default value 2. Example: see also Fig. 23.3
a = 1.05;
% default a = 2
mu = linspace(a,5,25);
nu = linspace(1,a,25);
rho = 0.5;
[mu,nu,rho] = meshgrid(mu,nu,rho);
mu = mu(:);
nu = nu(:);
rho = rho(:);
[x,y,z] = edal2c(mu,nu,rho,a);
% transformation
x = reshape(x,25,25);
% visualization
y = reshape(y,25,25);
z = reshape(z,25,25);
figure
surf(x,y,z), shg
hold on
surf(-x,-y,z), surf(-x,y,z)
surf(x,-y,z), shg
view(-81.5,13.25)
xlabel(’x’), ylabel(’y’), zlabel(’z’)
title(’ellipsoidal’)
ellipsoidal
1.6
1.4
1.2
1
0.8
0.6
z
1.5
1
0.5
0
–0.5
–1
–1.5
–0.2
0
0
x
y
Fig. 23.3 Visualization of the ellipsoidal coordinate system, Eq. (23.24)
23 Coordinate Systems
23.2.2 Ellipsoidal Coordinates and Cone Coordinates
The SPECFUNPHYS function edal2c serves for the transformation of the
ellipsoidal coordinates to cartesian coordinates and the SPECFUNPHYS function
cone2c for the transformation from cone coordinates to cartesian coordinates.
edal2c The syntax of the function edal2c is [x,y,z] = edal2c(mu,nu,
rho,a) and coordinate transformation is given by Eqs. (23.24). The coordinate
values “mu, nu, rho” are either of the same size or scalar values. “a” (optional) is a
real scalar value larger than 1 with default value 2. Example: see also Fig. 23.3
a = 1.05;
% default a = 2
mu = linspace(a,5,25);
nu = linspace(1,a,25);
rho = 0.5;
[mu,nu,rho] = meshgrid(mu,nu,rho);
mu = mu(:);
nu = nu(:);
rho = rho(:);
[x,y,z] = edal2c(mu,nu,rho,a);
% transformation
x = reshape(x,25,25);
% visualization
y = reshape(y,25,25);
z = reshape(z,25,25);
figure
surf(x,y,z), shg
hold on
surf(-x,-y,z), surf(-x,y,z)
surf(x,-y,z), shg
view(-81.5,13.25)
xlabel(’x’), ylabel(’y’), zlabel(’z’)
title(’ellipsoidal’)
ellipsoidal
1.6
1.4
1.2
1
0.8
0.6
z
1.5
1
0.5
0
–0.5
–1
–1.5
–0.2
0
0
x
y
Fig. 23.3 Visualization of the ellipsoidal coordinate system, Eq. (23.24)