

150
6 Micromechanical Models of PVA-Based Bionanocomposite Films
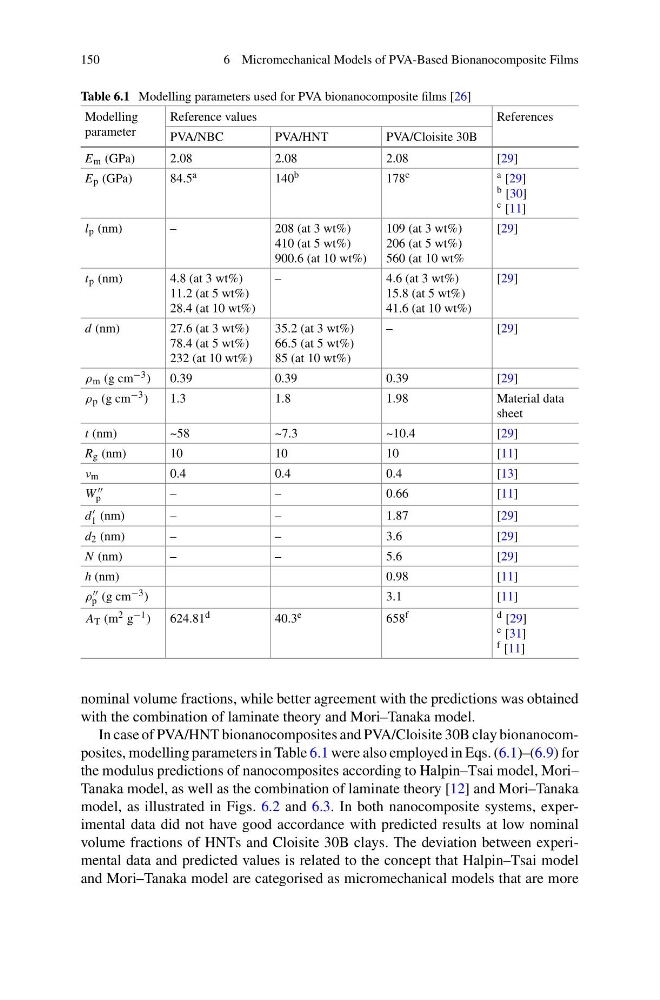
Table 6.1 Modelling parameters used for PVA bionanocomposite films [26]
Modelling
parameter
Reference values
References
PVA/NBC
PVA/HNT
PVA/Cloisite 30B
E m (GPa)
2.08
2.08
2.08
[29]
E p (GPa)
84.5 a
140 b
178 c
a [29]
b [30]
c [11]
l p (nm)
–
208 (at 3 wt%)
410 (at 5 wt%)
900.6 (at 10 wt%)
109 (at 3 wt%)
206 (at 5 wt%)
560 (at 10 wt%
[29]
t p (nm)
4.8 (at 3 wt%)
11.2 (at 5 wt%)
28.4 (at 10 wt%)
–
4.6 (at 3 wt%)
15.8 (at 5 wt%)
41.6 (at 10 wt%)
[29]
d (nm)
27.6 (at 3 wt%)
78.4 (at 5 wt%)
232 (at 10 wt%)
35.2 (at 3 wt%)
66.5 (at 5 wt%)
85 (at 10 wt%)
–
[29]
ρ m (g cm −3 )
0.39
0.39
0.39
[29]
ρ p (g cm −3 )
1.3
1.8
1.98
Material data
sheet
t (nm)
~58
~7.3
~10.4
[29]
R g (nm)
10
10
10
[11]
ν m
0.4
0.4
0.4
[13]
W
p
–
–
0.66
[11]
d
1 (nm)
–
–
1.87
[29]
d 2 (nm)
–
–
3.6
[29]
N (nm)
–
–
5.6
[29]
h (nm)
0.98
[11]
ρ
p (g cm −3 )
3.1
[11]
A T (m 2 g −1 )
624.81 d
40.3 e
658 f
d [29]
e [31]
f [11]
nominal volume fractions, while better agreement with the predictions was obtained
with the combination of laminate theory and Mori–Tanaka model.
In case of PVA/HNT bionanocomposites and PVA/Cloisite 30B clay bionanocomposites, modelling parameters in Table 6.1 were also employed in Eqs. (6.1)–(6.9) for
the modulus predictions of nanocomposites according to Halpin–Tsai model, Mori–
Tanaka model, as well as the combination of laminate theory [12] and Mori–Tanaka
model, as illustrated in Figs. 6.2 and 6.3. In both nanocomposite systems, experimental data did not have good accordance with predicted results at low nominal
volume fractions of HNTs and Cloisite 30B clays. The deviation between experimental data and predicted values is related to the concept that Halpin–Tsai model
and Mori–Tanaka model are categorised as micromechanical models that are more
6 Micromechanical Models of PVA-Based Bionanocomposite Films
Table 6.1 Modelling parameters used for PVA bionanocomposite films [26]
Modelling
parameter
Reference values
References
PVA/NBC
PVA/HNT
PVA/Cloisite 30B
E m (GPa)
2.08
2.08
2.08
[29]
E p (GPa)
84.5 a
140 b
178 c
a [29]
b [30]
c [11]
l p (nm)
–
208 (at 3 wt%)
410 (at 5 wt%)
900.6 (at 10 wt%)
109 (at 3 wt%)
206 (at 5 wt%)
560 (at 10 wt%
[29]
t p (nm)
4.8 (at 3 wt%)
11.2 (at 5 wt%)
28.4 (at 10 wt%)
–
4.6 (at 3 wt%)
15.8 (at 5 wt%)
41.6 (at 10 wt%)
[29]
d (nm)
27.6 (at 3 wt%)
78.4 (at 5 wt%)
232 (at 10 wt%)
35.2 (at 3 wt%)
66.5 (at 5 wt%)
85 (at 10 wt%)
–
[29]
ρ m (g cm −3 )
0.39
0.39
0.39
[29]
ρ p (g cm −3 )
1.3
1.8
1.98
Material data
sheet
t (nm)
~58
~7.3
~10.4
[29]
R g (nm)
10
10
10
[11]
ν m
0.4
0.4
0.4
[13]
W
p
–
–
0.66
[11]
d
1 (nm)
–
–
1.87
[29]
d 2 (nm)
–
–
3.6
[29]
N (nm)
–
–
5.6
[29]
h (nm)
0.98
[11]
ρ
p (g cm −3 )
3.1
[11]
A T (m 2 g −1 )
624.81 d
40.3 e
658 f
d [29]
e [31]
f [11]
nominal volume fractions, while better agreement with the predictions was obtained
with the combination of laminate theory and Mori–Tanaka model.
In case of PVA/HNT bionanocomposites and PVA/Cloisite 30B clay bionanocomposites, modelling parameters in Table 6.1 were also employed in Eqs. (6.1)–(6.9) for
the modulus predictions of nanocomposites according to Halpin–Tsai model, Mori–
Tanaka model, as well as the combination of laminate theory [12] and Mori–Tanaka
model, as illustrated in Figs. 6.2 and 6.3. In both nanocomposite systems, experimental data did not have good accordance with predicted results at low nominal
volume fractions of HNTs and Cloisite 30B clays. The deviation between experimental data and predicted values is related to the concept that Halpin–Tsai model
and Mori–Tanaka model are categorised as micromechanical models that are more