

5.2 Interphase Characterisation of PVA-Based Bionanocomposites
125
(a)
(c)
(d)
A21
B21
B21
A21
B21
B21
A21
A21
(b)
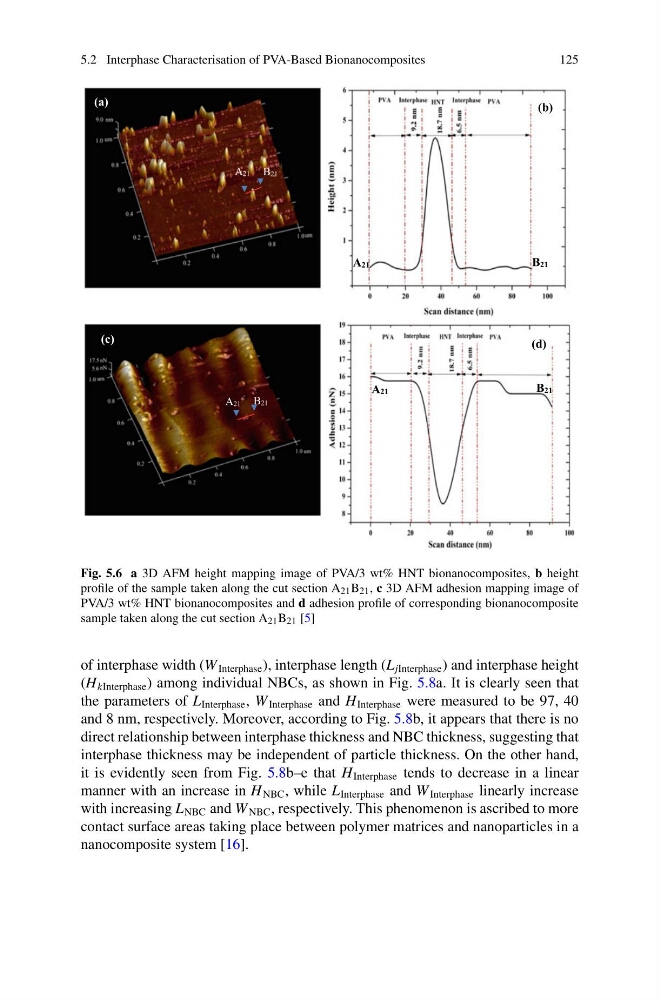
Fig. 5.6 a 3D AFM height mapping image of PVA/3 wt% HNT bionanocomposites, b height
profile of the sample taken along the cut section A 21 B 21 , c 3D AFM adhesion mapping image of
PVA/3 wt% HNT bionanocomposites and d adhesion profile of corresponding bionanocomposite
sample taken along the cut section A 21 B 21 [5]
of interphase width (W Interphase ), interphase length (L jInterphase ) and interphase height
(H kInterphase ) among individual NBCs, as shown in Fig. 5.8a. It is clearly seen that
the parameters of L Interphase , W Interphase and H Interphase were measured to be 97, 40
and 8 nm, respectively. Moreover, according to Fig. 5.8b, it appears that there is no
direct relationship between interphase thickness and NBC thickness, suggesting that
interphase thickness may be independent of particle thickness. On the other hand,
it is evidently seen from Fig. 5.8b–e that H Interphase tends to decrease in a linear
manner with an increase in H NBC , while L Interphase and W Interphase linearly increase
with increasing L NBC and W NBC , respectively. This phenomenon is ascribed to more
contact surface areas taking place between polymer matrices and nanoparticles in a
nanocomposite system [16].
125
(a)
(c)
(d)
A21
B21
B21
A21
B21
B21
A21
A21
(b)
Fig. 5.6 a 3D AFM height mapping image of PVA/3 wt% HNT bionanocomposites, b height
profile of the sample taken along the cut section A 21 B 21 , c 3D AFM adhesion mapping image of
PVA/3 wt% HNT bionanocomposites and d adhesion profile of corresponding bionanocomposite
sample taken along the cut section A 21 B 21 [5]
of interphase width (W Interphase ), interphase length (L jInterphase ) and interphase height
(H kInterphase ) among individual NBCs, as shown in Fig. 5.8a. It is clearly seen that
the parameters of L Interphase , W Interphase and H Interphase were measured to be 97, 40
and 8 nm, respectively. Moreover, according to Fig. 5.8b, it appears that there is no
direct relationship between interphase thickness and NBC thickness, suggesting that
interphase thickness may be independent of particle thickness. On the other hand,
it is evidently seen from Fig. 5.8b–e that H Interphase tends to decrease in a linear
manner with an increase in H NBC , while L Interphase and W Interphase linearly increase
with increasing L NBC and W NBC , respectively. This phenomenon is ascribed to more
contact surface areas taking place between polymer matrices and nanoparticles in a
nanocomposite system [16].