

126
5 3D Interphase of PVA Bionanocomposite Films
(a)
(c)
(b)
A22
B22
B22
A22
B22
A22
B22
A22
(d)
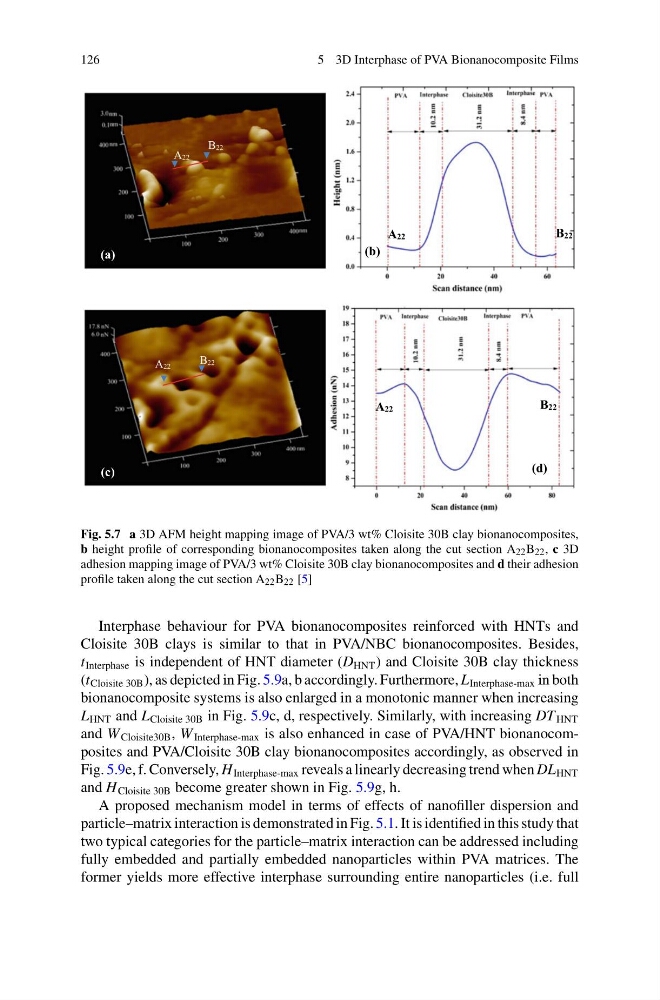
Fig. 5.7 a 3D AFM height mapping image of PVA/3 wt% Cloisite 30B clay bionanocomposites,
b height profile of corresponding bionanocomposites taken along the cut section A 22 B 22 , c 3D
adhesion mapping image of PVA/3 wt% Cloisite 30B clay bionanocomposites and d their adhesion
profile taken along the cut section A 22 B 22 [5]
Interphase behaviour for PVA bionanocomposites reinforced with HNTs and
Cloisite 30B clays is similar to that in PVA/NBC bionanocomposites. Besides,
t Interphase is independent of HNT diameter (D HNT ) and Cloisite 30B clay thickness
(t Cloisite 30B ), as depicted in Fig. 5.9a, b accordingly. Furthermore, L Interphase-max in both
bionanocomposite systems is also enlarged in a monotonic manner when increasing
L HNT and L Cloisite 30B in Fig. 5.9c, d, respectively. Similarly, with increasing DT HNT
and W Cloisite30B , W Interphase-max is also enhanced in case of PVA/HNT bionanocomposites and PVA/Cloisite 30B clay bionanocomposites accordingly, as observed in
Fig. 5.9e, f. Conversely, H Interphase-max reveals a linearly decreasing trend when DL HNT
and H Cloisite 30B become greater shown in Fig. 5.9g, h.
A proposed mechanism model in terms of effects of nanofiller dispersion and
particle–matrix interaction is demonstrated in Fig. 5.1. It is identified in this study that
two typical categories for the particle–matrix interaction can be addressed including
fully embedded and partially embedded nanoparticles within PVA matrices. The
former yields more effective interphase surrounding entire nanoparticles (i.e. full
5 3D Interphase of PVA Bionanocomposite Films
(a)
(c)
(b)
A22
B22
B22
A22
B22
A22
B22
A22
(d)
Fig. 5.7 a 3D AFM height mapping image of PVA/3 wt% Cloisite 30B clay bionanocomposites,
b height profile of corresponding bionanocomposites taken along the cut section A 22 B 22 , c 3D
adhesion mapping image of PVA/3 wt% Cloisite 30B clay bionanocomposites and d their adhesion
profile taken along the cut section A 22 B 22 [5]
Interphase behaviour for PVA bionanocomposites reinforced with HNTs and
Cloisite 30B clays is similar to that in PVA/NBC bionanocomposites. Besides,
t Interphase is independent of HNT diameter (D HNT ) and Cloisite 30B clay thickness
(t Cloisite 30B ), as depicted in Fig. 5.9a, b accordingly. Furthermore, L Interphase-max in both
bionanocomposite systems is also enlarged in a monotonic manner when increasing
L HNT and L Cloisite 30B in Fig. 5.9c, d, respectively. Similarly, with increasing DT HNT
and W Cloisite30B , W Interphase-max is also enhanced in case of PVA/HNT bionanocomposites and PVA/Cloisite 30B clay bionanocomposites accordingly, as observed in
Fig. 5.9e, f. Conversely, H Interphase-max reveals a linearly decreasing trend when DL HNT
and H Cloisite 30B become greater shown in Fig. 5.9g, h.
A proposed mechanism model in terms of effects of nanofiller dispersion and
particle–matrix interaction is demonstrated in Fig. 5.1. It is identified in this study that
two typical categories for the particle–matrix interaction can be addressed including
fully embedded and partially embedded nanoparticles within PVA matrices. The
former yields more effective interphase surrounding entire nanoparticles (i.e. full