

124
5 3D Interphase of PVA Bionanocomposite Films
A20
A20
B20
B20
(a)
(c)
(b)
A20
B20
(d)
A20
B20
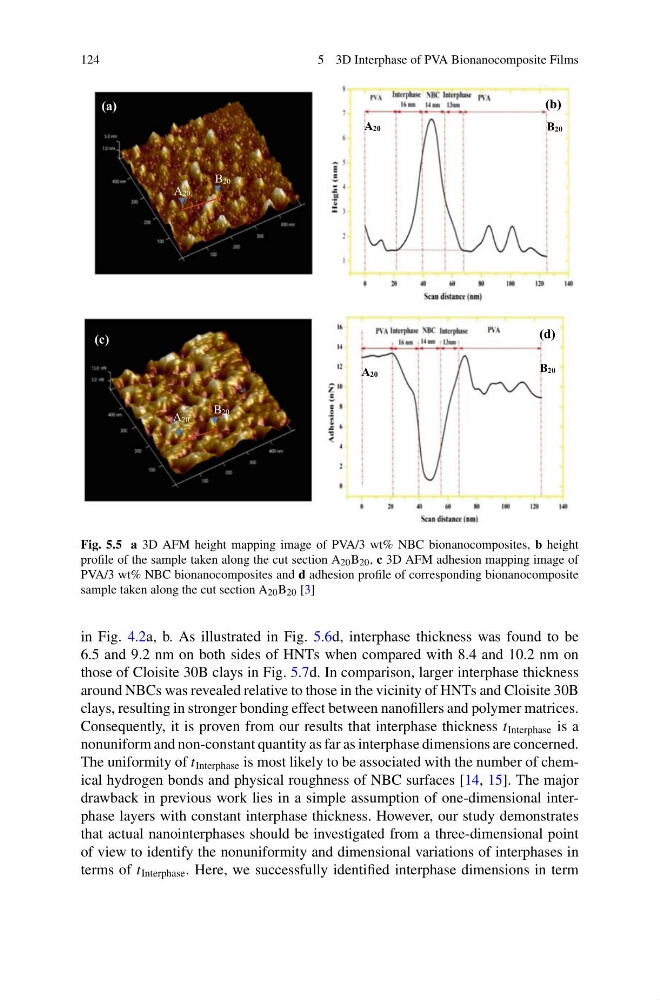
Fig. 5.5 a 3D AFM height mapping image of PVA/3 wt% NBC bionanocomposites, b height
profile of the sample taken along the cut section A 20 B 20 , c 3D AFM adhesion mapping image of
PVA/3 wt% NBC bionanocomposites and d adhesion profile of corresponding bionanocomposite
sample taken along the cut section A 20 B 20 [3]
in Fig. 4.2a, b. As illustrated in Fig. 5.6d, interphase thickness was found to be
6.5 and 9.2 nm on both sides of HNTs when compared with 8.4 and 10.2 nm on
those of Cloisite 30B clays in Fig. 5.7d. In comparison, larger interphase thickness
around NBCs was revealed relative to those in the vicinity of HNTs and Cloisite 30B
clays, resulting in stronger bonding effect between nanofillers and polymer matrices.
Consequently, it is proven from our results that interphase thickness t Interphase is a
nonuniform and non-constant quantity as far as interphase dimensions are concerned.
The uniformity of t Interphase is most likely to be associated with the number of chemical hydrogen bonds and physical roughness of NBC surfaces [14, 15]. The major
drawback in previous work lies in a simple assumption of one-dimensional interphase layers with constant interphase thickness. However, our study demonstrates
that actual nanointerphases should be investigated from a three-dimensional point
of view to identify the nonuniformity and dimensional variations of interphases in
terms of t Interphase . Here, we successfully identified interphase dimensions in term
5 3D Interphase of PVA Bionanocomposite Films
A20
A20
B20
B20
(a)
(c)
(b)
A20
B20
(d)
A20
B20
Fig. 5.5 a 3D AFM height mapping image of PVA/3 wt% NBC bionanocomposites, b height
profile of the sample taken along the cut section A 20 B 20 , c 3D AFM adhesion mapping image of
PVA/3 wt% NBC bionanocomposites and d adhesion profile of corresponding bionanocomposite
sample taken along the cut section A 20 B 20 [3]
in Fig. 4.2a, b. As illustrated in Fig. 5.6d, interphase thickness was found to be
6.5 and 9.2 nm on both sides of HNTs when compared with 8.4 and 10.2 nm on
those of Cloisite 30B clays in Fig. 5.7d. In comparison, larger interphase thickness
around NBCs was revealed relative to those in the vicinity of HNTs and Cloisite 30B
clays, resulting in stronger bonding effect between nanofillers and polymer matrices.
Consequently, it is proven from our results that interphase thickness t Interphase is a
nonuniform and non-constant quantity as far as interphase dimensions are concerned.
The uniformity of t Interphase is most likely to be associated with the number of chemical hydrogen bonds and physical roughness of NBC surfaces [14, 15]. The major
drawback in previous work lies in a simple assumption of one-dimensional interphase layers with constant interphase thickness. However, our study demonstrates
that actual nanointerphases should be investigated from a three-dimensional point
of view to identify the nonuniformity and dimensional variations of interphases in
terms of t Interphase . Here, we successfully identified interphase dimensions in term