

3.5 Electron
Microscopy (EM)
Examine nanocomplexes at the desired or the optimum ratios
obtained from the electrophoretic mobility shift assay (Subheading
3.2). Nanocomplexes must be prepared fresh on the day.
1. Add small amounts (1–2 μL) of the nanocomplex to formvar/
carbon-coated grids.
2. Air dry the grids and view sample under TEM (see Notes 20
and 21).
3. Once grids are dry, place the samples in liquid nitrogen for a
few minutes and then view if using Cryo-TEM [27].
3.6 Nanoparticle
Tracking
Analysis (NTA)
1. NTA is a robust method used to accurately determine the size,
dispersity, zeta potential, and colloidal stability in real time [24]
(see Notes 22–24).
2. Dilute nanocomplexes depending on the population density of
your nanocomplexes, to up to 1:1000 in ultrapure water so as
to produce particle numbers appropriate to the sensitivity limits
of the instrument (e.g., Nanosight NS500).
3. Prime the system, flush with ultrapure water, and set the camera at the zero position prior to loading of samples.
4. Visualize particles using the focused laser beam (405 nm,
60 mW) and the on-board sCMOS camera.
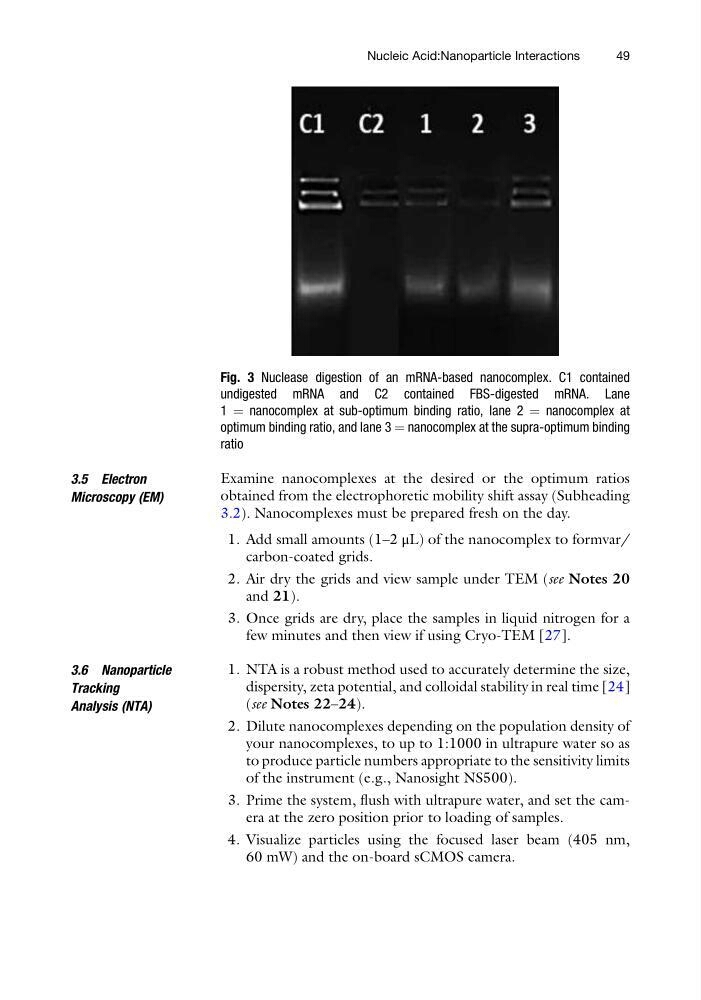
Fig. 3 Nuclease digestion of an mRNA-based nanocomplex. C1 contained
undigested mRNA and C2 contained FBS-digested mRNA. Lane
1 ¼ nanocomplex at sub-optimum binding ratio, lane 2 ¼ nanocomplex at
optimum binding ratio, and lane 3 ¼ nanocomplex at the supra-optimum binding
ratio
Nucleic Acid:Nanoparticle Interactions
49
Microscopy (EM)
Examine nanocomplexes at the desired or the optimum ratios
obtained from the electrophoretic mobility shift assay (Subheading
3.2). Nanocomplexes must be prepared fresh on the day.
1. Add small amounts (1–2 μL) of the nanocomplex to formvar/
carbon-coated grids.
2. Air dry the grids and view sample under TEM (see Notes 20
and 21).
3. Once grids are dry, place the samples in liquid nitrogen for a
few minutes and then view if using Cryo-TEM [27].
3.6 Nanoparticle
Tracking
Analysis (NTA)
1. NTA is a robust method used to accurately determine the size,
dispersity, zeta potential, and colloidal stability in real time [24]
(see Notes 22–24).
2. Dilute nanocomplexes depending on the population density of
your nanocomplexes, to up to 1:1000 in ultrapure water so as
to produce particle numbers appropriate to the sensitivity limits
of the instrument (e.g., Nanosight NS500).
3. Prime the system, flush with ultrapure water, and set the camera at the zero position prior to loading of samples.
4. Visualize particles using the focused laser beam (405 nm,
60 mW) and the on-board sCMOS camera.
Fig. 3 Nuclease digestion of an mRNA-based nanocomplex. C1 contained
undigested mRNA and C2 contained FBS-digested mRNA. Lane
1 ¼ nanocomplex at sub-optimum binding ratio, lane 2 ¼ nanocomplex at
optimum binding ratio, and lane 3 ¼ nanocomplex at the supra-optimum binding
ratio
Nucleic Acid:Nanoparticle Interactions
49