

Fig. 3 Schematic illustration of CDNs production. The U937 cells were passed through the spin cups fitted with
various size membrane filters and subsequently purified via size extrusion to obtained CDNs with desired size.
(Reproduced from Goh et al. [29] with permission from SpringerNature)
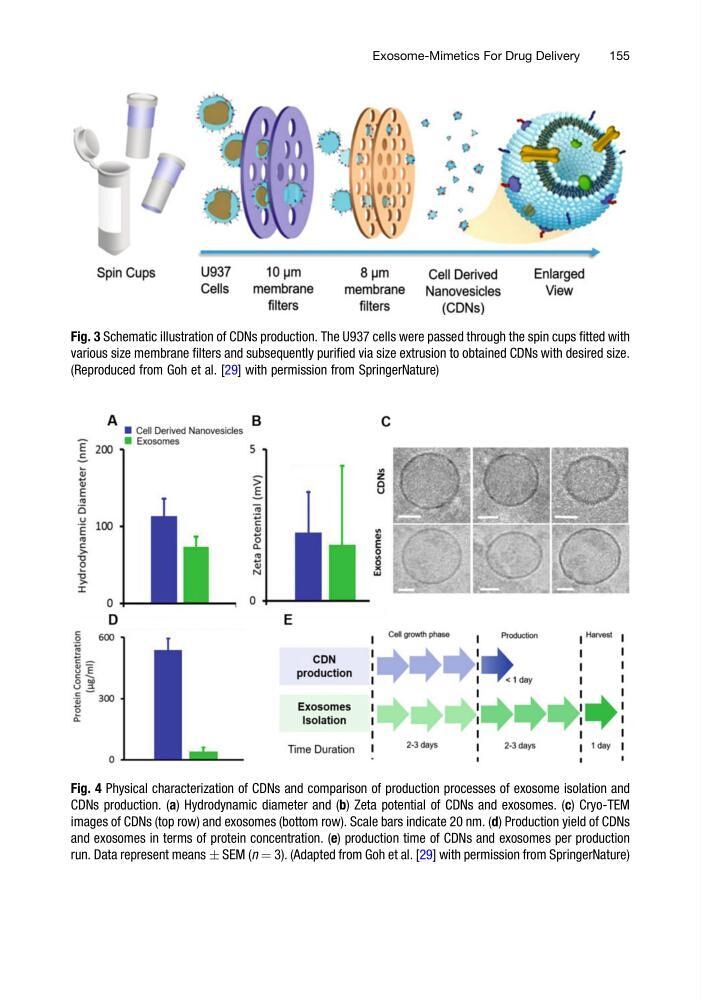
Fig. 4 Physical characterization of CDNs and comparison of production processes of exosome isolation and
CDNs production. (a) Hydrodynamic diameter and (b) Zeta potential of CDNs and exosomes. (c) Cryo-TEM
images of CDNs (top row) and exosomes (bottom row). Scale bars indicate 20 nm. (d) Production yield of CDNs
and exosomes in terms of protein concentration. (e) production time of CDNs and exosomes per production
run. Data represent means Æ SEM (n ¼ 3). (Adapted from Goh et al. [29] with permission from SpringerNature)
Exosome-Mimetics For Drug Delivery
155
various size membrane filters and subsequently purified via size extrusion to obtained CDNs with desired size.
(Reproduced from Goh et al. [29] with permission from SpringerNature)
Fig. 4 Physical characterization of CDNs and comparison of production processes of exosome isolation and
CDNs production. (a) Hydrodynamic diameter and (b) Zeta potential of CDNs and exosomes. (c) Cryo-TEM
images of CDNs (top row) and exosomes (bottom row). Scale bars indicate 20 nm. (d) Production yield of CDNs
and exosomes in terms of protein concentration. (e) production time of CDNs and exosomes per production
run. Data represent means Æ SEM (n ¼ 3). (Adapted from Goh et al. [29] with permission from SpringerNature)
Exosome-Mimetics For Drug Delivery
155