

318
M. Méndez and T. M. Belloni
(a)
(b)
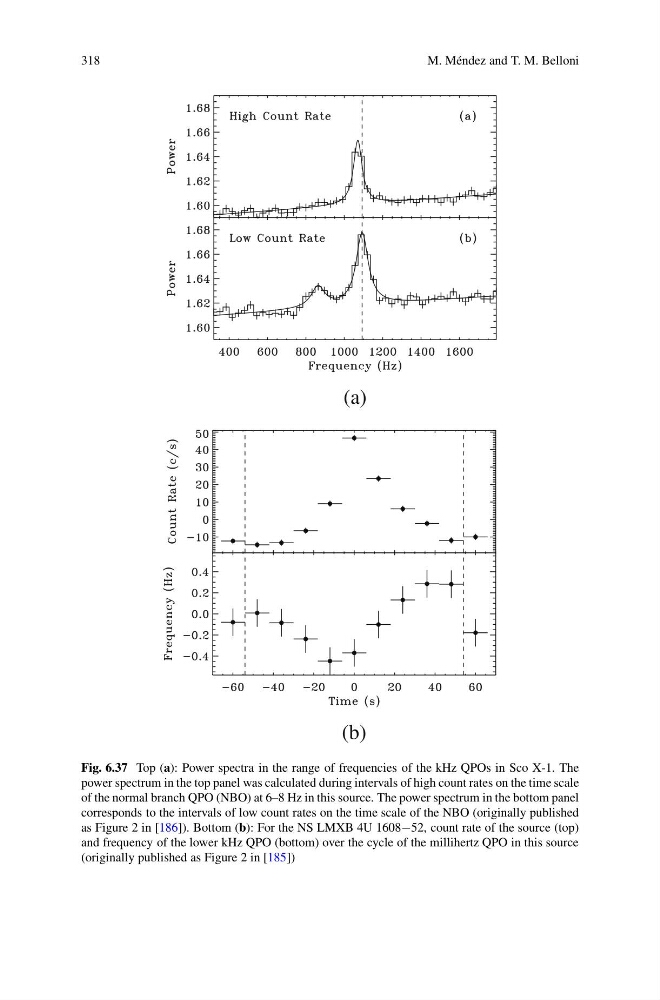
Fig. 6.37 Top (a): Power spectra in the range of frequencies of the kHz QPOs in Sco X-1. The
power spectrum in the top panel was calculated during intervals of high count rates on the time scale
of the normal branch QPO (NBO) at 6–8 Hz in this source. The power spectrum in the bottom panel
corresponds to the intervals of low count rates on the time scale of the NBO (originally published
as Figure 2 in [186]). Bottom (b): For the NS LMXB 4U 1608−52, count rate of the source (top)
and frequency of the lower kHz QPO (bottom) over the cycle of the millihertz QPO in this source
(originally published as Figure 2 in [185])
M. Méndez and T. M. Belloni
(a)
(b)
Fig. 6.37 Top (a): Power spectra in the range of frequencies of the kHz QPOs in Sco X-1. The
power spectrum in the top panel was calculated during intervals of high count rates on the time scale
of the normal branch QPO (NBO) at 6–8 Hz in this source. The power spectrum in the bottom panel
corresponds to the intervals of low count rates on the time scale of the NBO (originally published
as Figure 2 in [186]). Bottom (b): For the NS LMXB 4U 1608−52, count rate of the source (top)
and frequency of the lower kHz QPO (bottom) over the cycle of the millihertz QPO in this source
(originally published as Figure 2 in [185])