

6 High-Frequency Variability in Neutron-Star Low-Mass X-ray Binaries
317
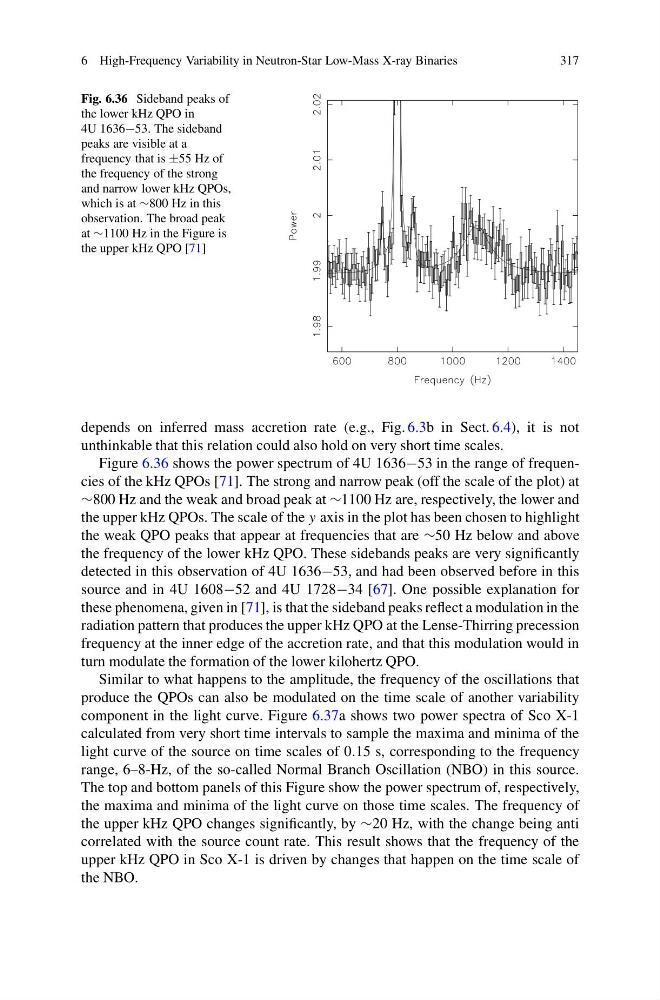
Fig. 6.36 Sideband peaks of
the lower kHz QPO in
4U 1636−53. The sideband
peaks are visible at a
frequency that is ±55 Hz of
the frequency of the strong
and narrow lower kHz QPOs,
which is at ∼800 Hz in this
observation. The broad peak
at ∼1100 Hz in the Figure is
the upper kHz QPO [71]
depends on inferred mass accretion rate (e.g., Fig. 6.3b in Sect. 6.4), it is not
unthinkable that this relation could also hold on very short time scales.
Figure 6.36 shows the power spectrum of 4U 1636−53 in the range of frequencies of the kHz QPOs [71]. The strong and narrow peak (off the scale of the plot) at
∼800 Hz and the weak and broad peak at ∼1100 Hz are, respectively, the lower and
the upper kHz QPOs. The scale of the y axis in the plot has been chosen to highlight
the weak QPO peaks that appear at frequencies that are ∼50 Hz below and above
the frequency of the lower kHz QPO. These sidebands peaks are very significantly
detected in this observation of 4U 1636−53, and had been observed before in this
source and in 4U 1608−52 and 4U 1728−34 [67]. One possible explanation for
these phenomena, given in [71], is that the sideband peaks reflect a modulation in the
radiation pattern that produces the upper kHz QPO at the Lense-Thirring precession
frequency at the inner edge of the accretion rate, and that this modulation would in
turn modulate the formation of the lower kilohertz QPO.
Similar to what happens to the amplitude, the frequency of the oscillations that
produce the QPOs can also be modulated on the time scale of another variability
component in the light curve. Figure 6.37a shows two power spectra of Sco X-1
calculated from very short time intervals to sample the maxima and minima of the
light curve of the source on time scales of 0.15 s, corresponding to the frequency
range, 6–8-Hz, of the so-called Normal Branch Oscillation (NBO) in this source.
The top and bottom panels of this Figure show the power spectrum of, respectively,
the maxima and minima of the light curve on those time scales. The frequency of
the upper kHz QPO changes significantly, by ∼20 Hz, with the change being anti
correlated with the source count rate. This result shows that the frequency of the
upper kHz QPO in Sco X-1 is driven by changes that happen on the time scale of
the NBO.
317
Fig. 6.36 Sideband peaks of
the lower kHz QPO in
4U 1636−53. The sideband
peaks are visible at a
frequency that is ±55 Hz of
the frequency of the strong
and narrow lower kHz QPOs,
which is at ∼800 Hz in this
observation. The broad peak
at ∼1100 Hz in the Figure is
the upper kHz QPO [71]
depends on inferred mass accretion rate (e.g., Fig. 6.3b in Sect. 6.4), it is not
unthinkable that this relation could also hold on very short time scales.
Figure 6.36 shows the power spectrum of 4U 1636−53 in the range of frequencies of the kHz QPOs [71]. The strong and narrow peak (off the scale of the plot) at
∼800 Hz and the weak and broad peak at ∼1100 Hz are, respectively, the lower and
the upper kHz QPOs. The scale of the y axis in the plot has been chosen to highlight
the weak QPO peaks that appear at frequencies that are ∼50 Hz below and above
the frequency of the lower kHz QPO. These sidebands peaks are very significantly
detected in this observation of 4U 1636−53, and had been observed before in this
source and in 4U 1608−52 and 4U 1728−34 [67]. One possible explanation for
these phenomena, given in [71], is that the sideband peaks reflect a modulation in the
radiation pattern that produces the upper kHz QPO at the Lense-Thirring precession
frequency at the inner edge of the accretion rate, and that this modulation would in
turn modulate the formation of the lower kilohertz QPO.
Similar to what happens to the amplitude, the frequency of the oscillations that
produce the QPOs can also be modulated on the time scale of another variability
component in the light curve. Figure 6.37a shows two power spectra of Sco X-1
calculated from very short time intervals to sample the maxima and minima of the
light curve of the source on time scales of 0.15 s, corresponding to the frequency
range, 6–8-Hz, of the so-called Normal Branch Oscillation (NBO) in this source.
The top and bottom panels of this Figure show the power spectrum of, respectively,
the maxima and minima of the light curve on those time scales. The frequency of
the upper kHz QPO changes significantly, by ∼20 Hz, with the change being anti
correlated with the source count rate. This result shows that the frequency of the
upper kHz QPO in Sco X-1 is driven by changes that happen on the time scale of
the NBO.