

6 High-Frequency Variability in Neutron-Star Low-Mass X-ray Binaries
313
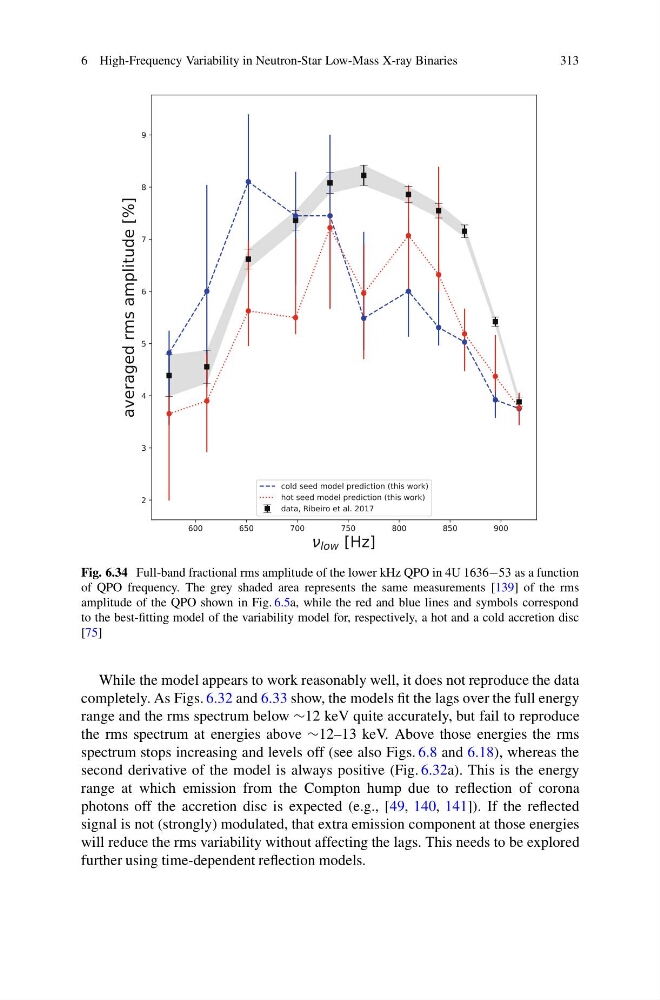
Fig. 6.34 Full-band fractional rms amplitude of the lower kHz QPO in 4U 1636−53 as a function
of QPO frequency. The grey shaded area represents the same measurements [139] of the rms
amplitude of the QPO shown in Fig. 6.5a, while the red and blue lines and symbols correspond
to the best-fitting model of the variability model for, respectively, a hot and a cold accretion disc
[75]
While the model appears to work reasonably well, it does not reproduce the data
completely. As Figs. 6.32 and 6.33 show, the models fit the lags over the full energy
range and the rms spectrum below ∼12 keV quite accurately, but fail to reproduce
the rms spectrum at energies above ∼12–13 keV. Above those energies the rms
spectrum stops increasing and levels off (see also Figs. 6.8 and 6.18), whereas the
second derivative of the model is always positive (Fig. 6.32a). This is the energy
range at which emission from the Compton hump due to reflection of corona
photons off the accretion disc is expected (e.g., [49, 140, 141]). If the reflected
signal is not (strongly) modulated, that extra emission component at those energies
will reduce the rms variability without affecting the lags. This needs to be explored
further using time-dependent reflection models.
313
Fig. 6.34 Full-band fractional rms amplitude of the lower kHz QPO in 4U 1636−53 as a function
of QPO frequency. The grey shaded area represents the same measurements [139] of the rms
amplitude of the QPO shown in Fig. 6.5a, while the red and blue lines and symbols correspond
to the best-fitting model of the variability model for, respectively, a hot and a cold accretion disc
[75]
While the model appears to work reasonably well, it does not reproduce the data
completely. As Figs. 6.32 and 6.33 show, the models fit the lags over the full energy
range and the rms spectrum below ∼12 keV quite accurately, but fail to reproduce
the rms spectrum at energies above ∼12–13 keV. Above those energies the rms
spectrum stops increasing and levels off (see also Figs. 6.8 and 6.18), whereas the
second derivative of the model is always positive (Fig. 6.32a). This is the energy
range at which emission from the Compton hump due to reflection of corona
photons off the accretion disc is expected (e.g., [49, 140, 141]). If the reflected
signal is not (strongly) modulated, that extra emission component at those energies
will reduce the rms variability without affecting the lags. This needs to be explored
further using time-dependent reflection models.