

312
M. Méndez and T. M. Belloni
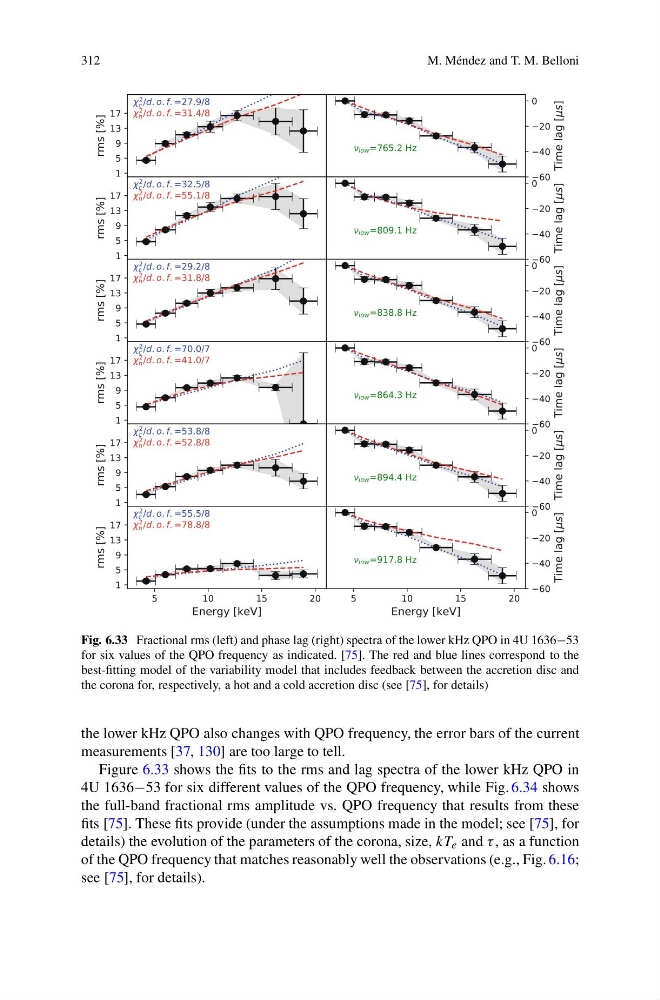
Fig. 6.33 Fractional rms (left) and phase lag (right) spectra of the lower kHz QPO in 4U 1636−53
for six values of the QPO frequency as indicated. [75]. The red and blue lines correspond to the
best-fitting model of the variability model that includes feedback between the accretion disc and
the corona for, respectively, a hot and a cold accretion disc (see [75], for details)
the lower kHz QPO also changes with QPO frequency, the error bars of the current
measurements [37, 130] are too large to tell.
Figure 6.33 shows the fits to the rms and lag spectra of the lower kHz QPO in
4U 1636−53 for six different values of the QPO frequency, while Fig. 6.34 shows
the full-band fractional rms amplitude vs. QPO frequency that results from these
fits [75]. These fits provide (under the assumptions made in the model; see [75], for
details) the evolution of the parameters of the corona, size, kT e and τ , as a function
of the QPO frequency that matches reasonably well the observations (e.g., Fig. 6.16;
see [75], for details).
M. Méndez and T. M. Belloni
Fig. 6.33 Fractional rms (left) and phase lag (right) spectra of the lower kHz QPO in 4U 1636−53
for six values of the QPO frequency as indicated. [75]. The red and blue lines correspond to the
best-fitting model of the variability model that includes feedback between the accretion disc and
the corona for, respectively, a hot and a cold accretion disc (see [75], for details)
the lower kHz QPO also changes with QPO frequency, the error bars of the current
measurements [37, 130] are too large to tell.
Figure 6.33 shows the fits to the rms and lag spectra of the lower kHz QPO in
4U 1636−53 for six different values of the QPO frequency, while Fig. 6.34 shows
the full-band fractional rms amplitude vs. QPO frequency that results from these
fits [75]. These fits provide (under the assumptions made in the model; see [75], for
details) the evolution of the parameters of the corona, size, kT e and τ , as a function
of the QPO frequency that matches reasonably well the observations (e.g., Fig. 6.16;
see [75], for details).