

6 High-Frequency Variability in Neutron-Star Low-Mass X-ray Binaries
311
disc will be delayed with respect to those photons from the corona that are directly
emitted towards the observer. Since the disc temperature is lower than that of the
corona, the process results in a delay of the soft with respect to the hard photons, as
observed.
This process can be modelled by solving the time-dependent version of the
Kompaneets equation [81], assuming a geometry of the corona [75, 82, 83, 91, 92].
Since the inverse Compton scattering process cools down the electrons in the corona,
there has to be an external source of heating [100, 111] to explain long-lived coronas
in accreting LMXBs. If the photon flux from the disc that cools the corona is
variable, the power provided by this external heating source must also be variable
to maintain the equilibrium in the system. An interesting aspect of this approach is
that the solution of the equation that describes the variability of the flux received by
the observer provides both the energy-dependent amplitude and lags of the signal,
and hence one can fit, with the same model, both the rms and lag spectrum of the
QPOs.
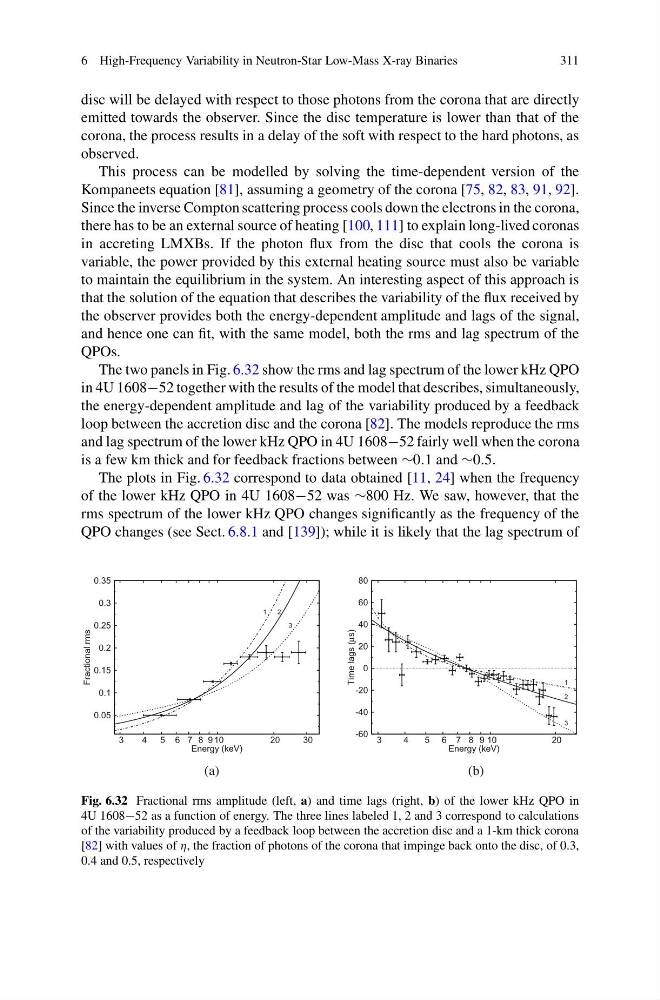
The two panels in Fig. 6.32 show the rms and lag spectrum of the lower kHz QPO
in 4U 1608−52 together with the results of the model that describes, simultaneously,
the energy-dependent amplitude and lag of the variability produced by a feedback
loop between the accretion disc and the corona [82]. The models reproduce the rms
and lag spectrum of the lower kHz QPO in 4U 1608−52 fairly well when the corona
is a few km thick and for feedback fractions between ∼0.1 and ∼0.5.
The plots in Fig. 6.32 correspond to data obtained [11, 24] when the frequency
of the lower kHz QPO in 4U 1608−52 was ∼800 Hz. We saw, however, that the
rms spectrum of the lower kHz QPO changes significantly as the frequency of the
QPO changes (see Sect. 6.8.1 and [139]); while it is likely that the lag spectrum of
0.05
0.1
0.15
0.2
0.25
0.3
0.35
30
20
10
9
8
7
6
5
4
3
Fractional rms
Energy (keV)
1
2
3
(a)
-60
-40
-20
0
20
40
60
80
20
10
9
8
7
6
5
4
3
Time lags (μs)
Energy (keV)
1
2
3
(b)
Fig. 6.32 Fractional rms amplitude (left, a) and time lags (right, b) of the lower kHz QPO in
4U 1608−52 as a function of energy. The three lines labeled 1, 2 and 3 correspond to calculations
of the variability produced by a feedback loop between the accretion disc and a 1-km thick corona
[82] with values of η, the fraction of photons of the corona that impinge back onto the disc, of 0.3,
0.4 and 0.5, respectively
311
disc will be delayed with respect to those photons from the corona that are directly
emitted towards the observer. Since the disc temperature is lower than that of the
corona, the process results in a delay of the soft with respect to the hard photons, as
observed.
This process can be modelled by solving the time-dependent version of the
Kompaneets equation [81], assuming a geometry of the corona [75, 82, 83, 91, 92].
Since the inverse Compton scattering process cools down the electrons in the corona,
there has to be an external source of heating [100, 111] to explain long-lived coronas
in accreting LMXBs. If the photon flux from the disc that cools the corona is
variable, the power provided by this external heating source must also be variable
to maintain the equilibrium in the system. An interesting aspect of this approach is
that the solution of the equation that describes the variability of the flux received by
the observer provides both the energy-dependent amplitude and lags of the signal,
and hence one can fit, with the same model, both the rms and lag spectrum of the
QPOs.
The two panels in Fig. 6.32 show the rms and lag spectrum of the lower kHz QPO
in 4U 1608−52 together with the results of the model that describes, simultaneously,
the energy-dependent amplitude and lag of the variability produced by a feedback
loop between the accretion disc and the corona [82]. The models reproduce the rms
and lag spectrum of the lower kHz QPO in 4U 1608−52 fairly well when the corona
is a few km thick and for feedback fractions between ∼0.1 and ∼0.5.
The plots in Fig. 6.32 correspond to data obtained [11, 24] when the frequency
of the lower kHz QPO in 4U 1608−52 was ∼800 Hz. We saw, however, that the
rms spectrum of the lower kHz QPO changes significantly as the frequency of the
QPO changes (see Sect. 6.8.1 and [139]); while it is likely that the lag spectrum of
0.05
0.1
0.15
0.2
0.25
0.3
0.35
30
20
10
9
8
7
6
5
4
3
Fractional rms
Energy (keV)
1
2
3
(a)
-60
-40
-20
0
20
40
60
80
20
10
9
8
7
6
5
4
3
Time lags (μs)
Energy (keV)
1
2
3
(b)
Fig. 6.32 Fractional rms amplitude (left, a) and time lags (right, b) of the lower kHz QPO in
4U 1608−52 as a function of energy. The three lines labeled 1, 2 and 3 correspond to calculations
of the variability produced by a feedback loop between the accretion disc and a 1-km thick corona
[82] with values of η, the fraction of photons of the corona that impinge back onto the disc, of 0.3,
0.4 and 0.5, respectively