

314
M. Méndez and T. M. Belloni
0
0.5
1
Intrinsic coherence
lower kHz QPO
4 6 8 10 12 14 16 18 20
−0.1
0
0.1
0.2
Intrinsic coherence
E [keV]
upper kHz QPO
lower kHz QPO
4U 1608−52
4U 1636−53
600
800
1000
1200
<ν> [Hz]
upper kHz QPO
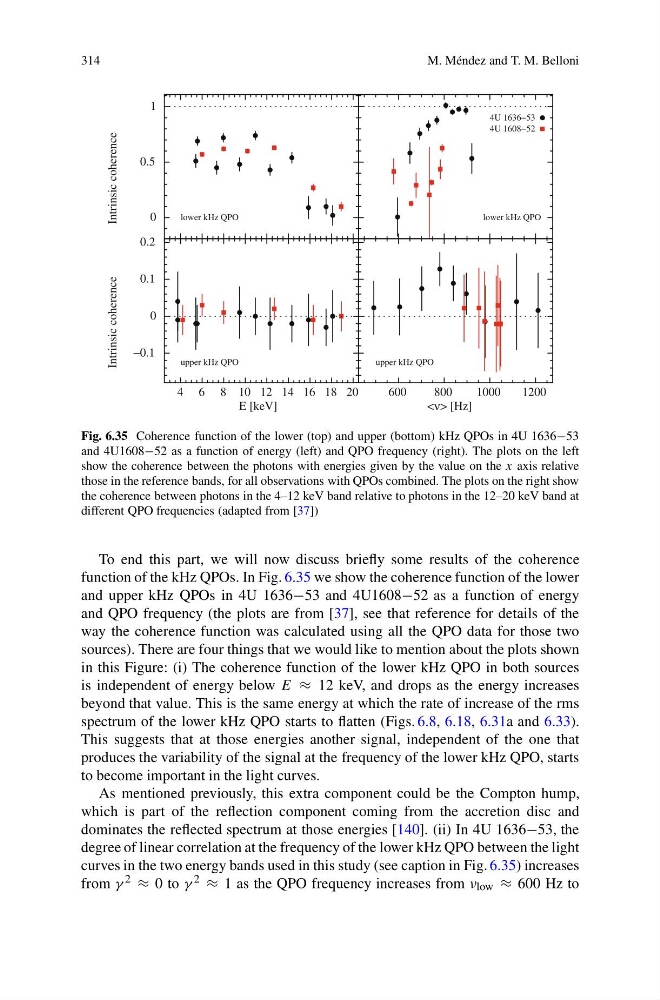
Fig. 6.35 Coherence function of the lower (top) and upper (bottom) kHz QPOs in 4U 1636−53
and 4U1608−52 as a function of energy (left) and QPO frequency (right). The plots on the left
show the coherence between the photons with energies given by the value on the x axis relative
those in the reference bands, for all observations with QPOs combined. The plots on the right show
the coherence between photons in the 4–12 keV band relative to photons in the 12–20 keV band at
different QPO frequencies (adapted from [37])
To end this part, we will now discuss briefly some results of the coherence
function of the kHz QPOs. In Fig. 6.35 we show the coherence function of the lower
and upper kHz QPOs in 4U 1636−53 and 4U1608−52 as a function of energy
and QPO frequency (the plots are from [37], see that reference for details of the
way the coherence function was calculated using all the QPO data for those two
sources). There are four things that we would like to mention about the plots shown
in this Figure: (i) The coherence function of the lower kHz QPO in both sources
is independent of energy below E ≈ 12 keV, and drops as the energy increases
beyond that value. This is the same energy at which the rate of increase of the rms
spectrum of the lower kHz QPO starts to flatten (Figs. 6.8, 6.18, 6.31a and 6.33).
This suggests that at those energies another signal, independent of the one that
produces the variability of the signal at the frequency of the lower kHz QPO, starts
to become important in the light curves.
As mentioned previously, this extra component could be the Compton hump,
which is part of the reflection component coming from the accretion disc and
dominates the reflected spectrum at those energies [140]. (ii) In 4U 1636−53, the
degree of linear correlation at the frequency of the lower kHz QPO between the light
curves in the two energy bands used in this study (see caption in Fig. 6.35) increases
from γ 2 ≈ 0 to γ 2 ≈ 1 as the QPO frequency increases from ν low ≈ 600 Hz to
M. Méndez and T. M. Belloni
0
0.5
1
Intrinsic coherence
lower kHz QPO
4 6 8 10 12 14 16 18 20
−0.1
0
0.1
0.2
Intrinsic coherence
E [keV]
upper kHz QPO
lower kHz QPO
4U 1608−52
4U 1636−53
600
800
1000
1200
<ν> [Hz]
upper kHz QPO
Fig. 6.35 Coherence function of the lower (top) and upper (bottom) kHz QPOs in 4U 1636−53
and 4U1608−52 as a function of energy (left) and QPO frequency (right). The plots on the left
show the coherence between the photons with energies given by the value on the x axis relative
those in the reference bands, for all observations with QPOs combined. The plots on the right show
the coherence between photons in the 4–12 keV band relative to photons in the 12–20 keV band at
different QPO frequencies (adapted from [37])
To end this part, we will now discuss briefly some results of the coherence
function of the kHz QPOs. In Fig. 6.35 we show the coherence function of the lower
and upper kHz QPOs in 4U 1636−53 and 4U1608−52 as a function of energy
and QPO frequency (the plots are from [37], see that reference for details of the
way the coherence function was calculated using all the QPO data for those two
sources). There are four things that we would like to mention about the plots shown
in this Figure: (i) The coherence function of the lower kHz QPO in both sources
is independent of energy below E ≈ 12 keV, and drops as the energy increases
beyond that value. This is the same energy at which the rate of increase of the rms
spectrum of the lower kHz QPO starts to flatten (Figs. 6.8, 6.18, 6.31a and 6.33).
This suggests that at those energies another signal, independent of the one that
produces the variability of the signal at the frequency of the lower kHz QPO, starts
to become important in the light curves.
As mentioned previously, this extra component could be the Compton hump,
which is part of the reflection component coming from the accretion disc and
dominates the reflected spectrum at those energies [140]. (ii) In 4U 1636−53, the
degree of linear correlation at the frequency of the lower kHz QPO between the light
curves in the two energy bands used in this study (see caption in Fig. 6.35) increases
from γ 2 ≈ 0 to γ 2 ≈ 1 as the QPO frequency increases from ν low ≈ 600 Hz to